Combining correlated Log Lines in Google Stackdriver
2018-06-14This article covers several techniques you can employ to combine separate log lines such that they appear nested. Normally, when you emit logs for Google Cloud Logging, each log line shows up separately and uncorrelated. This makes tracing and understanding errors pretty difficult: what you’ll see are separate, seemingly unrelated stream of messages in cloud logging console. What if you could combine separate log entries in one HttpRequest that were all part of the same request and GCP does the correlation for you: when you go to the Cloud Console, you’d see these ‘parent-child’ together.
The procedure with GCP’s Cloud Logging does describe how to do that here:
- “Linking app logs and requests In the App Engine flexible environment, app logs can be correlated with a particular request. Following are the requirements:
- The parent log entry must include a value for httpRequest.requestUrl.
- The child log entry must have a different log name than the parent. Typically, the child log entry is an app log entry in the app log, whereas the parent log entry is in the request log. The values for resource.type, resource.labels, and trace must be the same in the parent and its child(ren).
- The child log entry’s timestamp must be within the time interval covered by the parent request. It must be earlier than parent.timestamp and later than parent.timestamp - parent.httpRequest.latency.”
What this article shows implementations of the sequence above in two ways: Using Stackdriver Logging Agent and then using Stackdriver API in golang. I’ve provided some references below for similar capability while using a language framework like java-spring.
You can find the source here
Flask extension for grouped log lines for Google Cloud Logging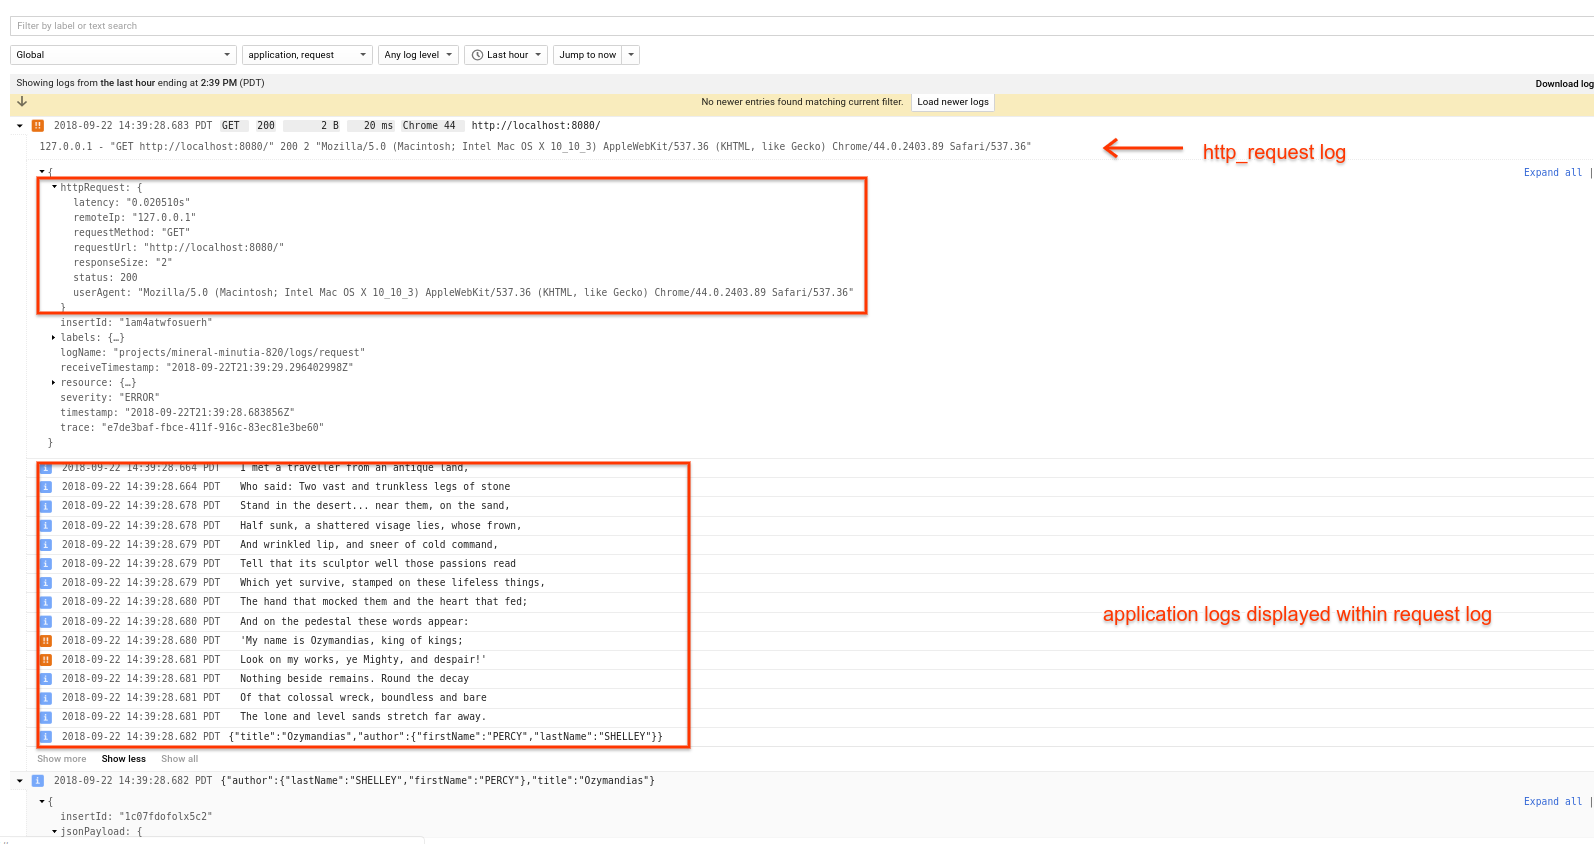
Logging combined
Note, that the application log entry does appear in the unfiltered logs still but users will ‘see’ all the log lines associated with the parent http_request.
What makes this possible is attaching the traceID field to each application log entry as well as emitting the parent http_request. Google cloud logging will use the traceID and “collapse” them together.
Setup
Stackdriver Agent
Lets start off with the Agent
- Create a GCE instance
To demonstrate this mechanism, first create a GCE VM. Use the Cloud Console to set up a debian instance and remember to keep the default access levels (we need Stackdriver Logging API enabled on the VM).
- SSH to the VM
$ sudo su -
$ curl -sSO "https://dl.google.com/cloudagents/install-logging-agent.sh"
$ bash install-logging-agent.sh --structured
- Create Root Logging Config
$ cat /etc/google-fluentd/config.d/test-structured-log.conf
<source>
    @type tail
    format json
    path /tmp/test-structured-log.log
    pos_file /var/lib/google-fluentd/pos/test-structured-log.pos
    read_from_head true
    tag structured-log
</source>
- Create Child Logging Config
$ cat /etc/google-fluentd/config.d/test-child-log.conf
<source>
    @type tail
    format json
    path /tmp/test-child-log.log
    pos_file /var/lib/google-fluentd/pos/test-child-log.pos
    read_from_head true
    tag child-log
</source>
- Restart the Agent
$ service google-fluentd restart
$ service google-fluentd status
- Emit Logs
python agent_logger.py
You should see lines in the log file as:
# more /tmp/test-structured-log.log
{"httpRequest": {"status": 200, "latency": "1.010 s", "requestUrl": "https://example.com/1", "requestMethod": "GET", "remoteIp": "1.2.3.4", "userAgent": "my-user-agent", "responseSize
": 1023}, "logging.googleapis.com/trace": "3dea50fd-0e2e-4bfd-bf61-0ded0f2ff82b", "severity": "INFO"}
# more /tmp/test-child-log.log
{"message": "child message!", "labels": {"name": "child-log"}, "logging.googleapis.com/trace": "3dea50fd-0e2e-4bfd-bf61-0ded0f2ff82b", "severity": "INFO"}
You can also check if the log lines got ingested by the agent properly by viewing /var/log/google-fluentd/google-fluentd.log
Check Cloud Logging Console
On the cloud Console, navigate to “GCE VM Instance” (select the instance you used for this), then select structured-log as the type:
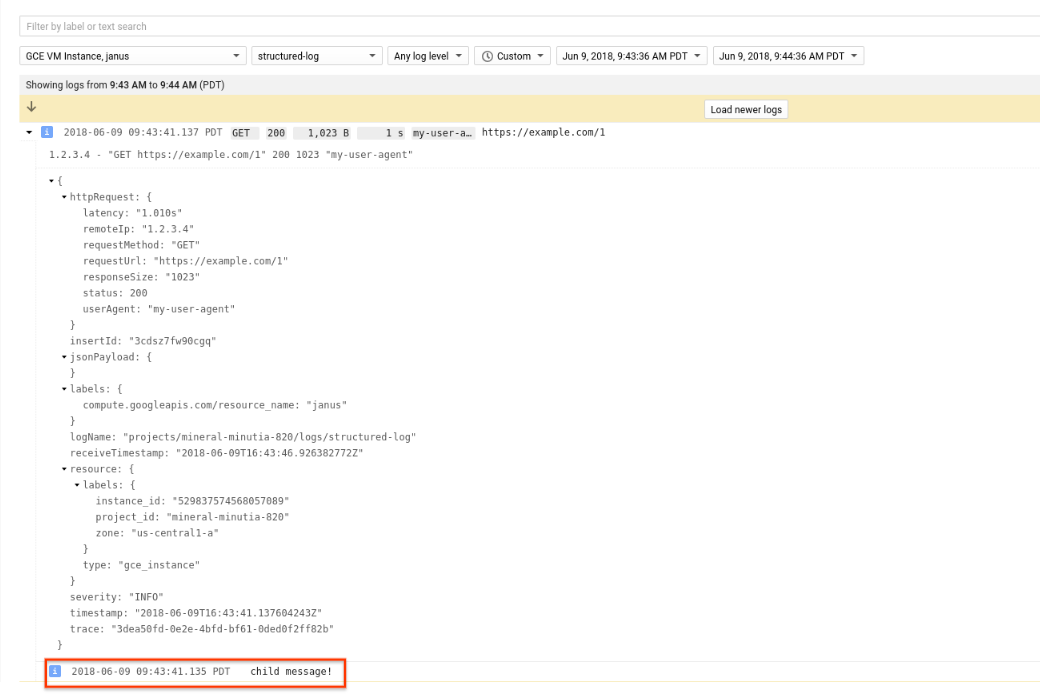
Notice the bit highlighted in red: that log entry is the ‘child’ that shows up after expanding the original HTTP request!
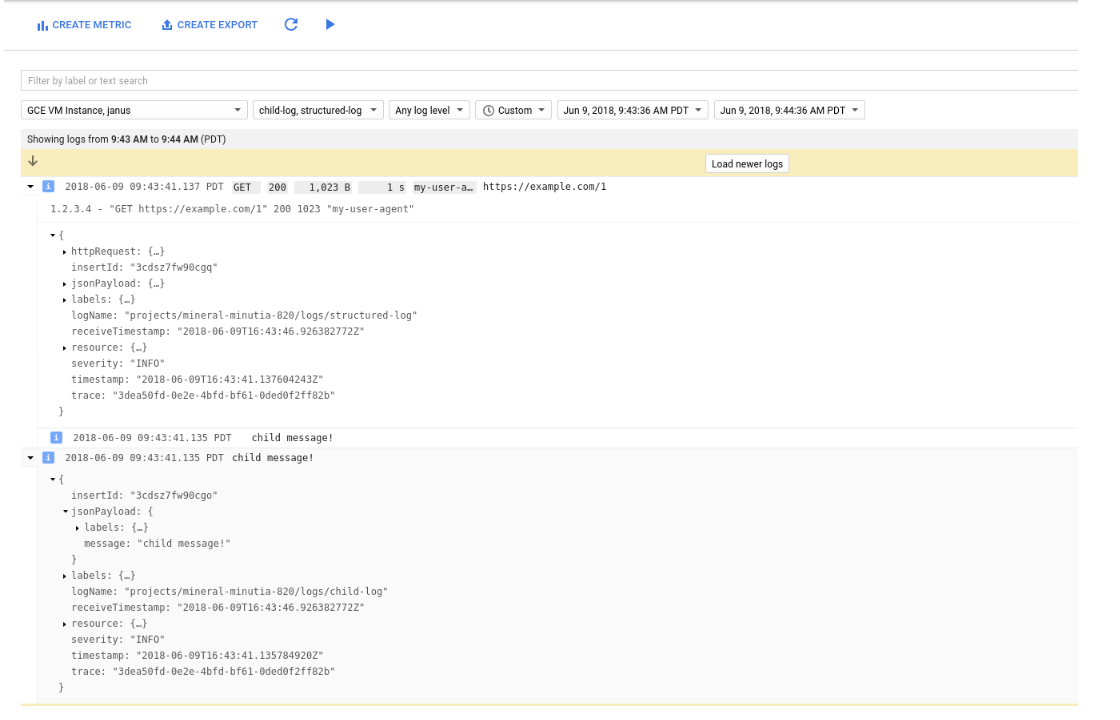
The child logs are emitted separately in a different log target used for this correlation. You can find the child log under child-log target. If you want to see the consolidated and child log entries together as separate types, select both of them as shown below:
Cloud Logging API
In this section, we will setup cloud logging via the API.
First, make sure you have google cloud sdk installed (gcloud) and have it configured for a project with the Stackdriver API enabled. You should also login to initialize Application Default Credentials (gcloud auth application-default login). We are going to use your local credentials to emit log entries so your role within the project should have atleast the stackdriver log writer IAM role.
start webserver
$ go run src/main.go
send some traffic
$ curl -H "User-Agent: Mozilla/5.0 (Macintosh; Intel Mac OS X 10_10_3) AppleWebKit/537.36 (KHTML, like Gecko) Chrome/44.0.2403.89 Safari/537.36" -H "X-Cloud-Trace-Context: `python -c "import uuid; print uuid.uuid4()"`" http://localhost:8080/
Check cloud logging console
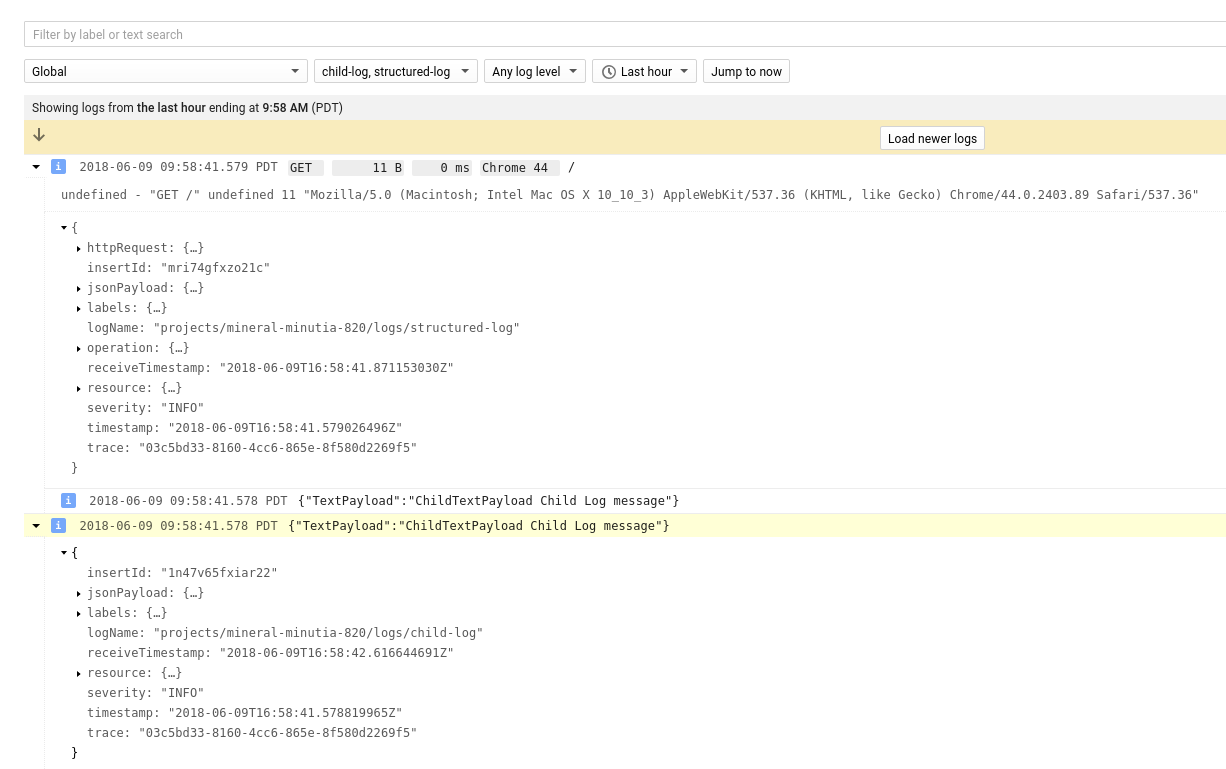
Unlike the agent in the previous section, we emitted these logs to the global type. On the cloud console, navigate to global as shown in the screenshots here and select structured-log. You should see the parent-child logs together
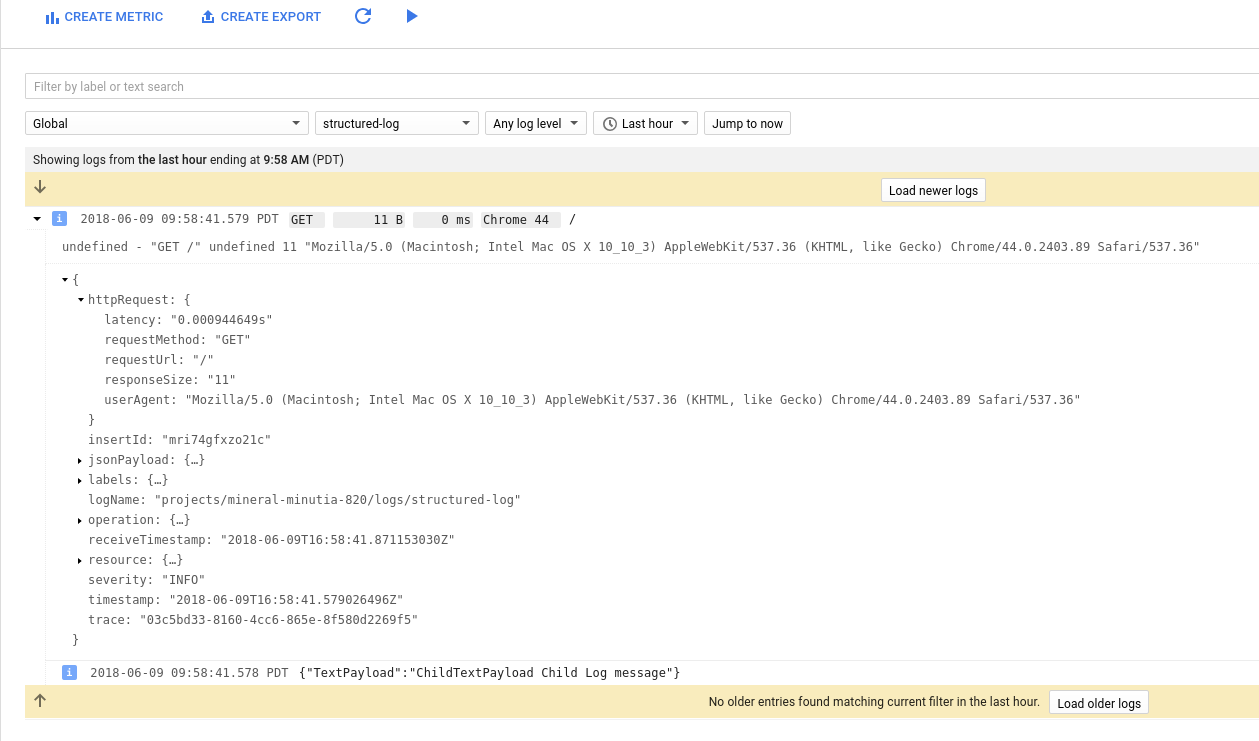
As above the parent-child logs are shown in separate log types so if you want to see both together, select both
main.go
agent_logger.py
This site supports webmentions. Send me a mention via this form.