Using Stackdriver* with golang on Istio
2019-08-19This is a simplification of https://github.com/GoogleCloudPlatform/istio-samples/tree/master/istio-stackdriver as a ‘hello world’ type application. The istio sample for Stackdriver uses the microservices-demo application. The microservices demo is nice but includes a lot of things i don’t find necessary to understand specific technologies.
I find using a simple frontend->backend reference as instructive for me to learn so i setup
- https://github.com/salrashid123/istio_helloworld sometime ago to learn istio. Now i’m combining much of the same code to help explain various
StackDrivertechnologies
Specifically, this repo explores using the following on GKE with Istio
- Stackdriver Logging
- Stackdriver Monitoring
- Stackdriver Trace
- Stackdriver Error Reporting
- Stackdriver Profiler
- Stackdriver Debugger*
- Opencensus Exporter for Stackdriver
and along the way, we will cover
You can pretty much pick and choose what you’re interested in but using this repo requires a significant invenstment in setup.
You can find the source here
Testing endpoints
- Frontend (
fe):
http.Handle("/", rootHandler)   // does nothing
http.Handle("/hostname", hostnameHander)  // emits back the hostname of the pod that got the request
http.Handle("/tracer", traceHandler)  // starts tracing requests to gcs and makes a call to the backend /tracer endpoint
http.Handle("/backend", backendHandler)  // just makes an http call to the backend
http.Handle("/log", logHandler)  // logs stuff
http.Handle("/delay", delayHandler) // adds in an artifical delay of 3s by default.  Accepts ?delay=2000 to daly 2s,etc
http.Handle("/error", errorHandler)  // emits a custom error
http.Handle("/debug", debugHandler)  // debug endpoint where you can setup a breakpoint (well, you can set one anywhere...)
http.Handle("/measure", trackVistHandler(measureHandler))  // emits a custom metric to opencensus-->stackdriver
- Backend (
be):
http.HandleFunc("/tracer", tracer)  // accepts an inbound trace context from frontend, used context to make a gcs call and then return
http.HandleFunc("/backend", backend) // just responds, ok
Setup
The setup is long, but we are going to cover a lot…
export PROJECT_ID=`gcloud config get-value core/project`
export PROJECT_NUMBER=`gcloud projects describe $PROJECT_ID --format="value(projectNumber)"`
Configure Project
Enable Services
gcloud services enable cloudtrace.googleapis.com compute.googleapis.com container.googleapis.com logging.googleapis.com monitoring.googleapis.com sourcerepo.googleapis.com stackdriver.googleapis.com clouddebugger.googleapis.com clouderrorreporting.googleapis.com cloudprofiler.googleapis.com
Add IAM permissions
gcloud iam service-accounts list

$PROJECT_NUMBER-compute@developer.gserviceaccount.com
$ gcloud iam service-accounts list
NAME EMAIL DISABLED
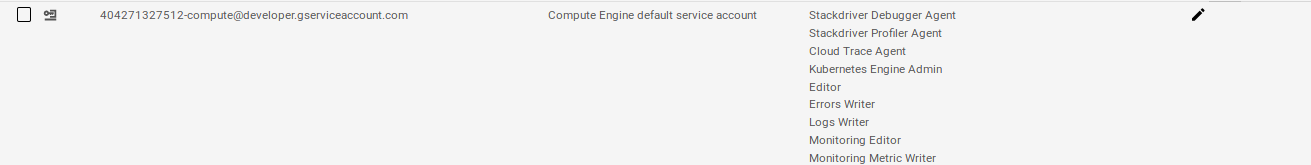
Compute Engine default service account 404271327512-compute@developer.gserviceaccount.com False
Add permission to default compute service account:
- Stackdriver Debugger Agent
- Stackdriver Profiler Agent
- Cloud Trace Agent
- Kubernetes Engine Admin
- Errors Writer
- Logs Writer
- Monitoring Metric Writer
- Monitoring Editor
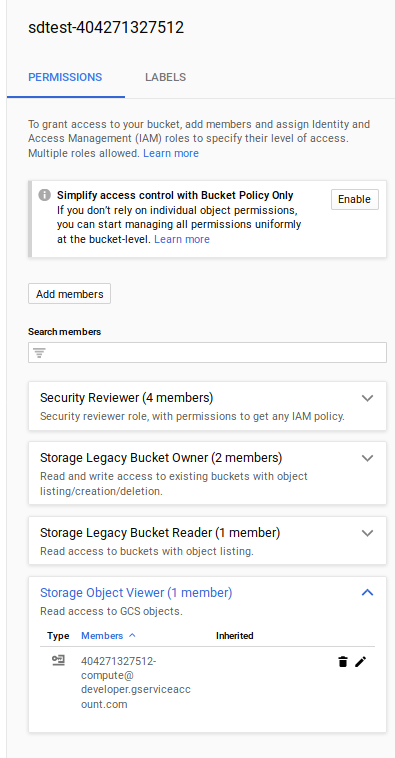
Create GCS bucket
Create bucket to upload a sample test file (this is used later for tracing demo)
gsutil mb gs://sdtest-$PROJECT_NUMBER

$ echo foo > some_file.txt
$ gsutil cp some_file.txt gs://sdtest-$PROJECT_NUMBER
Add permissions to the service account $PROJECT_NUMBER-compute@developer.gserviceaccount.com
Install GKE+Istio
Install GKE an the istio plugin.
Note, the supported version here is pinned and confirmed working
- Supported Versions –> Istio on GKE Version: 1.1.7-gke.0
export GKE_ISTIO_VERSION=1.1.7-gke.0
Deploy the cluster and enable some additional scopes:
gcloud beta container  clusters create gcp-demo --machine-type "n1-standard-2" --zone us-central1-a  --num-nodes 4 --enable-ip-alias  --enable-stackdriver-kubernetes --scopes "https://www.googleapis.com/auth/cloud-platform","https://www.googleapis.com/auth/devstorage.read_only","https://www.googleapis.com/auth/logging.write","https://www.googleapis.com/auth/monitoring","https://www.googleapis.com/auth/servicecontrol","https://www.googleapis.com/auth/service.management.readonly","https://www.googleapis.com/auth/trace.append,https://www.googleapis.com/auth/cloud_debugger","https://www.googleapis.com/auth/monitoring.write" --addons=Istio --istio-config=auth=MTLS_PERMISSIVE --cluster-version=1.13.7

gcloud container clusters get-credentials gcp-demo --zone us-central1-a

kubectl create clusterrolebinding cluster-admin-binding --clusterrole=cluster-admin --user=$(gcloud config get-value core/account)
Add Kiali
Install Kaili for topology graphs with options
First add prometheus to gke+istio since its not installed by default
curl https://storage.googleapis.com/gke-release/istio/release/1.0.3-gke.3/patches/install-prometheus.yaml | kubectl apply -n istio-system -f -
Now add in kaili configs. kaili.path installs just the Kaili from the options. To see how the .path file is generated, see Appendix section
cd istio_install
kubectl apply -f kiali_secret.yaml
kubectl apply -f kiali.patch
Start UI (username/password is admin/admin)
kubectl -n istio-system port-forward $(kubectl -n istio-system get pod -l app=kiali -o jsonpath='{.items[0].metadata.name}') 20001:20001
Add Stackdriver Trace
Add on configuration to gke+istio for enhanced stackdriver tracing:
kubectl edit -n istio-system rule stackdriver-tracing-rule
Find the line match: "false" and replace with
match: context.protocol == "http" || context.protocol == "grpc"
Register GCE Metadataserver and Services
Register Istio VirtualServices for MESH_EXTERNAL endpoints so we can see them in the UI
cd deploy_configs/
kubectl apply -f istio-egress-metadata.yaml
kubectl apply -f istio-egress-googleapis.yaml
Optionally Enable REGISTRY_ONLY Egress Policy
By default, istio+gke allows all outbound traffic. We’re paranoid so lets turn that off and only allow REGISTRY_ONLY
Shows we allow by default
  $ kubectl get configmap istio -n istio-system -o yaml | grep -o "mode: ALLOW_ANY"
    mode: ALLOW_ANY
    mode: ALLOW_ANY
so, runt he command here to enable registry:
- REGISTRY_ONLY:
kubectl get configmap istio -n istio-system -o yaml | sed 's/mode: REGISTRY_ONLY/mode: ALLOW_ANY/g' | kubectl replace -n istio-system -f -
(to revert it, you can always run)
- ALLOW_ANY:
kubectl get configmap istio -n istio-system -o yaml | sed 's/mode: ALLOW_ANY/mode: REGISTRY_ONLY/g' | kubectl replace -n istio-system -f -
(Optional) Setup Source Repo for Cloud Debugger
Now setup a cloud source repo to support the debugger. If you are not interested in Cloud Debugger, skip this step
If you want to manually select the source, skip this step and follow
Otherwise
# create directory off of the git root
mkdir stage/
cd stage/
gcloud source repos create fe
gcloud source repos clone fe

cd fe
_cp -R contents of  `minimal_gcp/fe/*` into the source repo folder
git add -A
git commit -m "update"
git push
Now acquire the source context file
$ gcloud debug source gen-repo-info-file --output-directory /tmp/src_context/
It will look something like:
$ cat /tmp/src_context/source-context.json
{
  "cloudRepo": {
    "repoId": {
      "projectRepoId": {
        "projectId": "$PROJECT",
        "repoName": "fe"
      }
    },
    "revisionId": "913f3cf0d8f36fd472a4538e9c8025d6df4e14ee"
  }
}
Edit debug-configmap.yaml with the source context information
- debug-configmap.yaml
apiVersion: v1
kind: ConfigMap
metadata:
  name: debug-configmap
data:
  config: |-
    {
      "cloudRepo": {
        "repoId": {
          "projectRepoId": {
            "projectId": "$PROJECT",
            "repoName": "fe"
          }
        },
        "revisionId": "913f3cf0d8f36fd472a4538e9c8025d6df4e14ee"
      }
    }
Build and push images
Now we’re ready to build and push the images to your won gcr.io repo. If you would rather use an image i setup, you can find them at
docker.io/salrashid123/fe_mindocker.io/salrashid123/be_min
cd minimal_gcp/fe
docker build  --build-arg VER=1 -f Dockerfile.prod -t gcr.io/$PROJECT_ID/fe_min:1 .
docker build  --build-arg VER=2 -f Dockerfile.prod -t gcr.io/$PROJECT_ID/fe_min:2 .
docker push gcr.io/$PROJECT_ID/fe_min:1
docker push gcr.io/$PROJECT_ID/fe_min:2

docker build  --build-arg VER=1 -f Dockerfile.debug -t gcr.io/$PROJECT_ID/fe_min:debug1 .
docker build  --build-arg VER=2 -f Dockerfile.debug -t gcr.io/$PROJECT_ID/fe_min:debug2 .
docker push gcr.io/$PROJECT_ID/fe_min:debug1
docker push gcr.io/$PROJECT_ID/fe_min:debug2
cd minimal_gcp/be
docker build  --build-arg VER=1 -f Dockerfile -t gcr.io/$PROJECT_ID/be_min:1 .
docker build  --build-arg VER=2 -f Dockerfile -t gcr.io/$PROJECT_ID/be_min:2 .
docker push  gcr.io/$PROJECT_ID/be_min:1
docker push  gcr.io/$PROJECT_ID/be_min:2
Deploy Application
We’re finally ready to deploy the app
- First get the
GATEWAY_IP
export GATEWAY_IP=$(kubectl -n istio-system get service istio-ingressgateway -o jsonpath='{.status.loadBalancer.ingress[0].ip}')
echo $GATEWAY_IP
Edit configmap.yaml, debug-configmap.yaml
Open and editor and modify configmap.yaml values for the project, gcs bucket you created and the gke cluster name
If you setup cloud source repo and for the debugger, edit debug-configmap.yaml
Prepare istio for ingress
The following step sets up istio for ingress to our test application
cd deploy_configs/

kubectl label namespace default istio-injection=enabled

kubectl apply -f istio-lb-certs.yaml
(wait a couple seconds)
kubectl apply -f istio-ingress-gateway.yaml
kubectl apply -f istio-services.yaml
kubectl apply -f configmap.yaml
kubectl apply -f debug-configmap.yaml
kubectl apply -f istio-deployment.yaml
The inital istio-deployment.yaml creates
fe:v1: 1 replicafe:v2: 0 replicabe:v1: 1 replicabe:v2: 0 replica
1. Deploy fev1->bev1
Ok, now we can finally see the endpoint.
The first test is to check traffic:
user –> istio-gateway –> fe:v1
kubectl apply -f istio-fev1-bev1.yaml
- Check Frontend
for i in {1..10}; do curl -sk -w "\n" -s http://$GATEWAY_IP/hostname &&  sleep 1; done

hello from myapp-v1-846c6988db-ptjld, i'm running version 1
hello from myapp-v1-846c6988db-ptjld, i'm running version 1
hello from myapp-v1-846c6988db-ptjld, i'm running version 1
hello from myapp-v1-846c6988db-ptjld, i'm running version 1
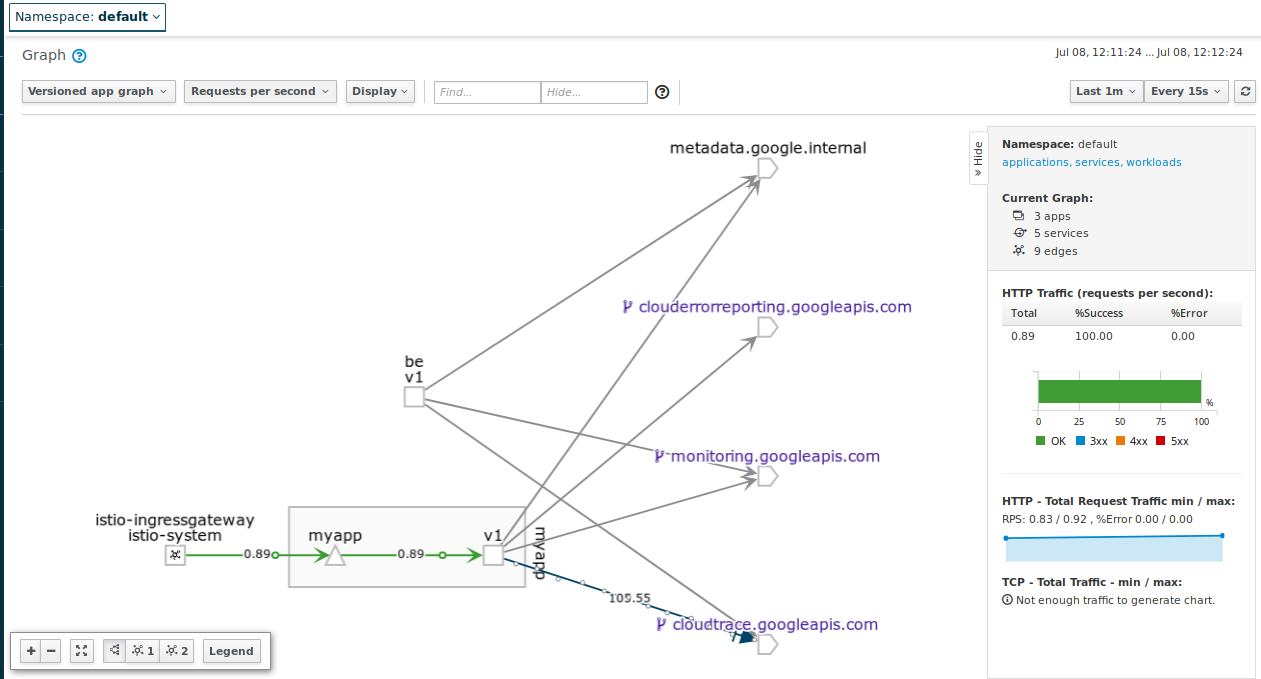
Ok, now send traffic to backend
user –> istio-gateway –> fe:v1 –> be:v1
for i in {1..10}; do curl -sk -w "\n" -s http://$GATEWAY_IP/backend &&  sleep 1; done

Response from Backend: This is a response from Backend be-v1-77f6fff764-nwvzk running version 1
Response from Backend: This is a response from Backend be-v1-77f6fff764-nwvzk running version 1
Response from Backend: This is a response from Backend be-v1-77f6fff764-nwvzk running version 1
Response from Backend: This is a response from Backend be-v1-77f6fff764-nwvzk running version 1
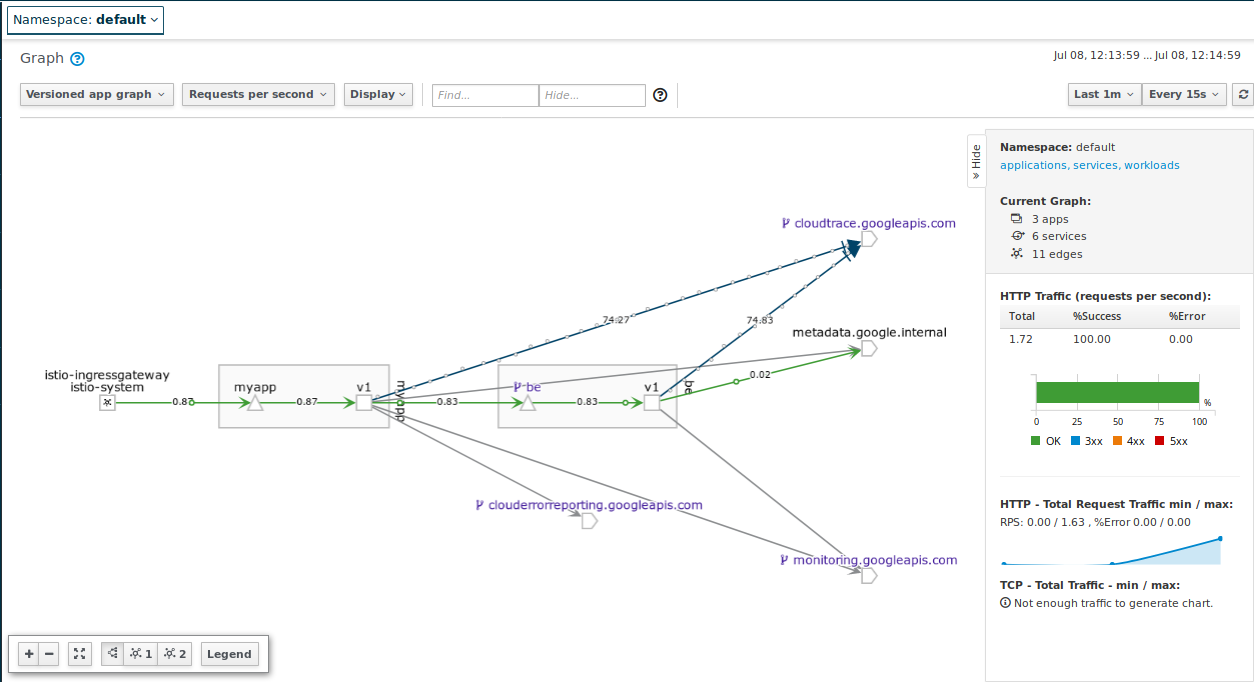
- Check Backend
for i in {1..10}; do curl -sk -w "\n" -s http://$GATEWAY_IP/trace && sleep 1; done
Deploy fev1v2->bev1, traffic split 50/50
Now bump up the instance count for fev2.
- Edit
-deployment.yaml, setmyapp-v2–> 1 replica
apiVersion: extensions/v1beta1
kind: Deployment
metadata:
  name: myapp-v2
spec:
  replicas: 1
  template:
    metadata:
      labels:
        app: myapp
        version: v2
Apply the update
kubectl apply -f istio-deployment.yaml
You should see fev2 as a target for the service but no traffic to i
Finally, apply the virtual service to traffic split
apiVersion: networking.istio.io/v1alpha3
kind: VirtualService
metadata:
  name: myapp-virtualservice
spec:
  hosts:
  - "*"
  gateways:
  - my-gateway
  - my-gateway-ilb
  http:
  - route:
    - destination:
        host: myapp
        subset: v1
      weight: 50
    - destination:
        host: myapp
        subset: v2
      weight: 50
kubectl apply -f istio-fev1v2-bev1.yaml
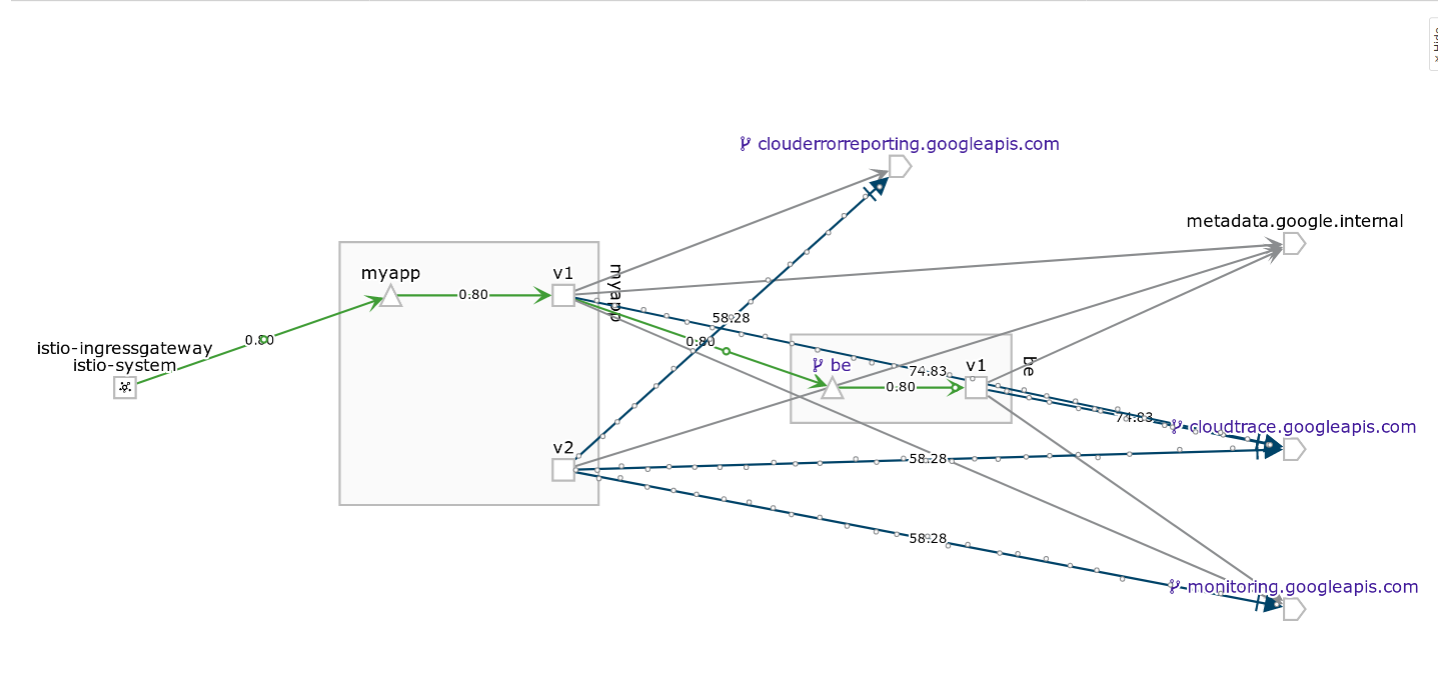
You’ll see 50/50 split on fev1:
Deploy fev1v2->bev1v2, traffic split 50/50
Increase instance count of bev2.
- Edit
-deployment.yaml, setbe-v2–> 1 replica
apiVersion: extensions/v1beta1
kind: Deployment
metadata:
  name: be-v2
  labels:
    type: be
    version: v2
spec:
  replicas: 1
  template:
    metadata:
      labels:
        app: be
Apply kubectl apply -f istio-deployment.yaml
Then allow traffic to bev2
kubectl apply -f istio-fev1v2-bev1v2.yaml
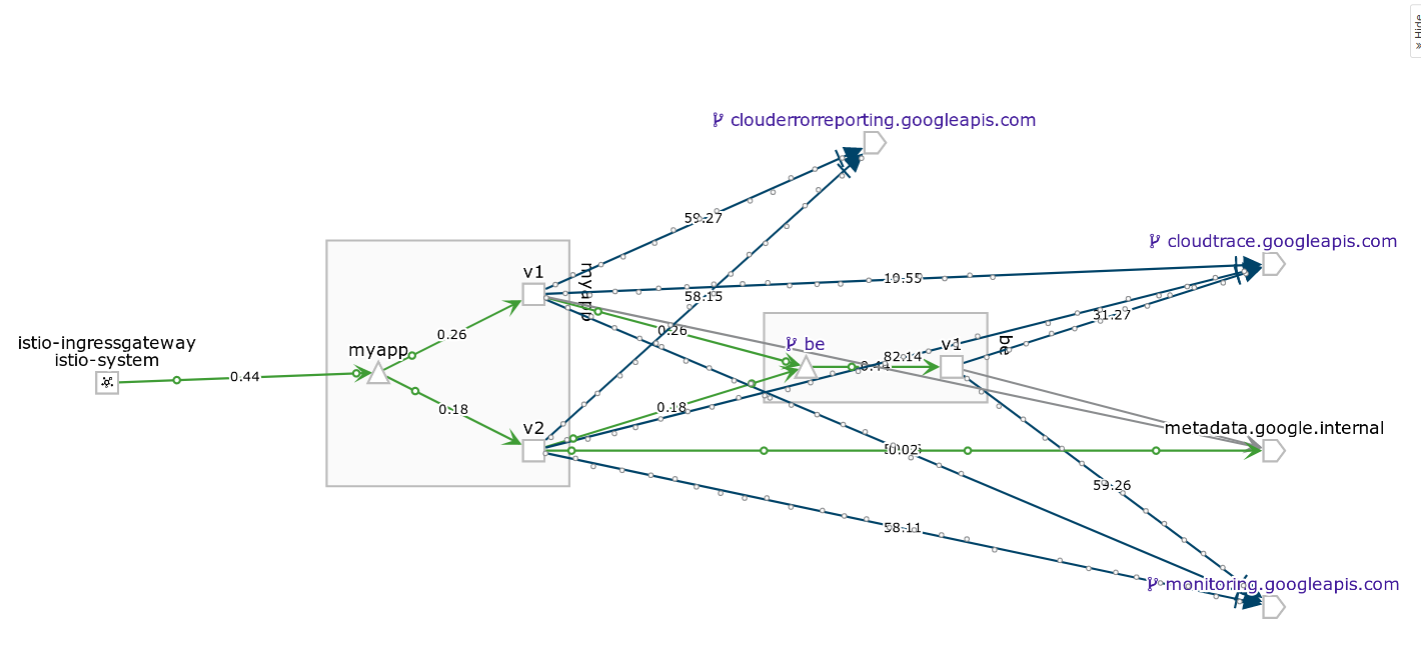
You should see responses from both backends
$ for i in {1..100}; do curl -sk -w "\n" -s http://$GATEWAY_IP/backend &&  sleep 1; done

Response from Backend: This is a response from Backend be-v1-77f6fff764-nwvzk running version 1
Response from Backend: This is a response from Backend be-v2-7c4566bc4b-2zgw4 running version 2
Response from Backend: This is a response from Backend be-v2-7c4566bc4b-2zgw4 running version 2
Response from Backend: This is a response from Backend be-v2-7c4566bc4b-2zgw4 running version 2
Response from Backend: This is a response from Backend be-v1-77f6fff764-nwvzk running version 1
Response from Backend: This is a response from Backend be-v1-77f6fff764-nwvzk running version 1
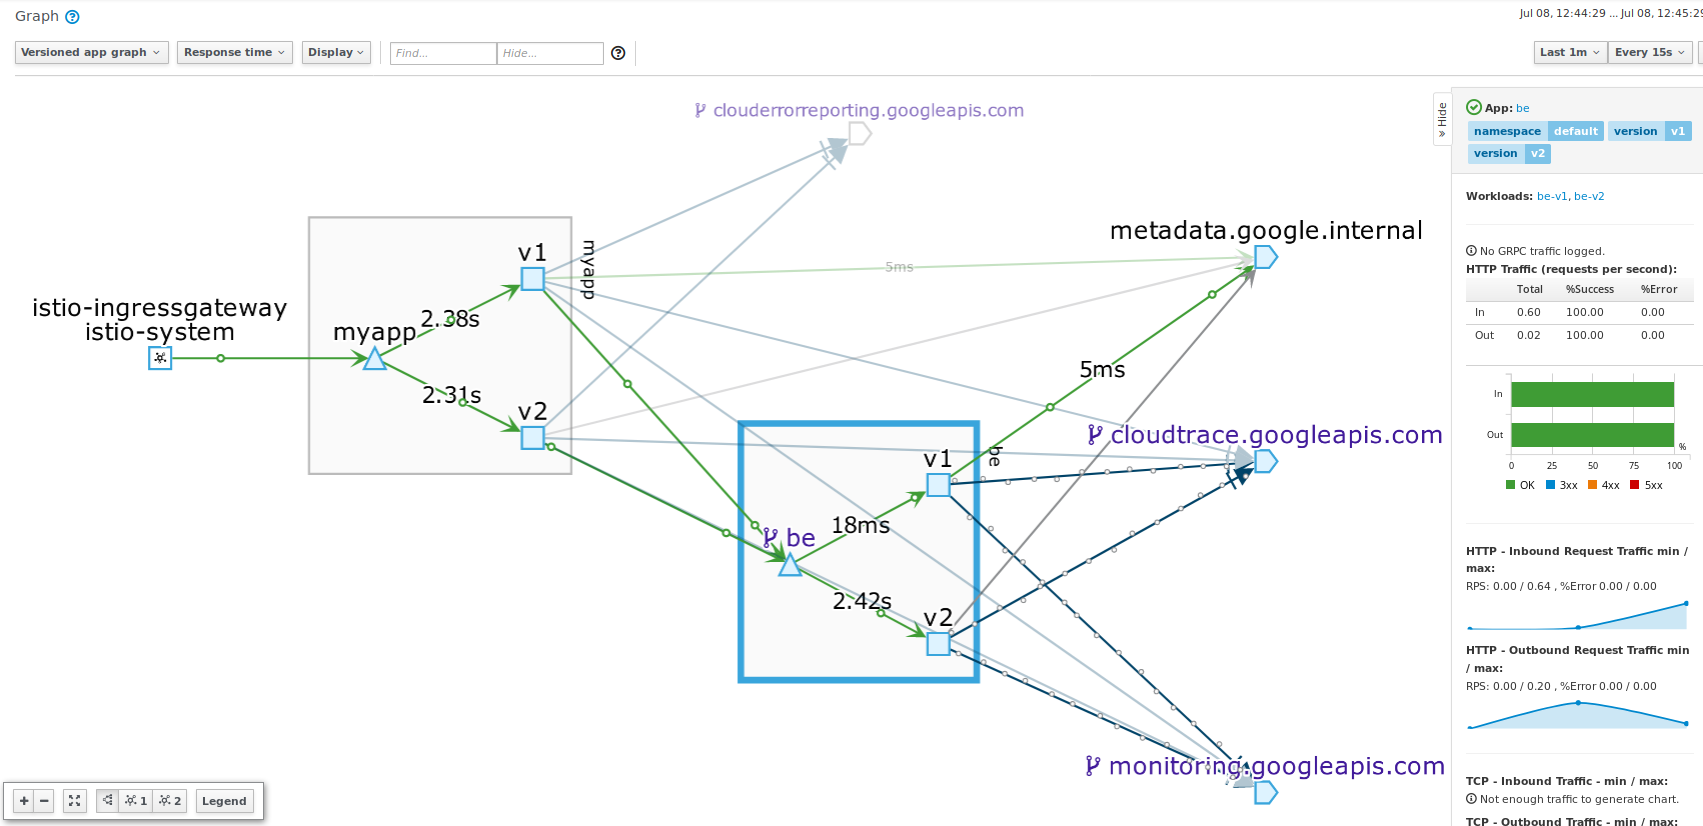
I’ve hardcoded backend v2 to add on an artificial latency
func backend(w http.ResponseWriter, r *http.Request) {
	log.Infof("...backend version %v called on %v", version, os.Getenv("MY_CONTAINER_NAME"))
	if version == "2" {
		log.Infof("...just doing nothing for... 1000ms")
		time.Sleep(time.Duration(1000) * time.Millisecond)
	}
	fmt.Fprintf(w, "This is a response from Backend %v running version %v", os.Getenv("MY_POD_NAME"), version)
}
Which means you will see that in kiali dashboard
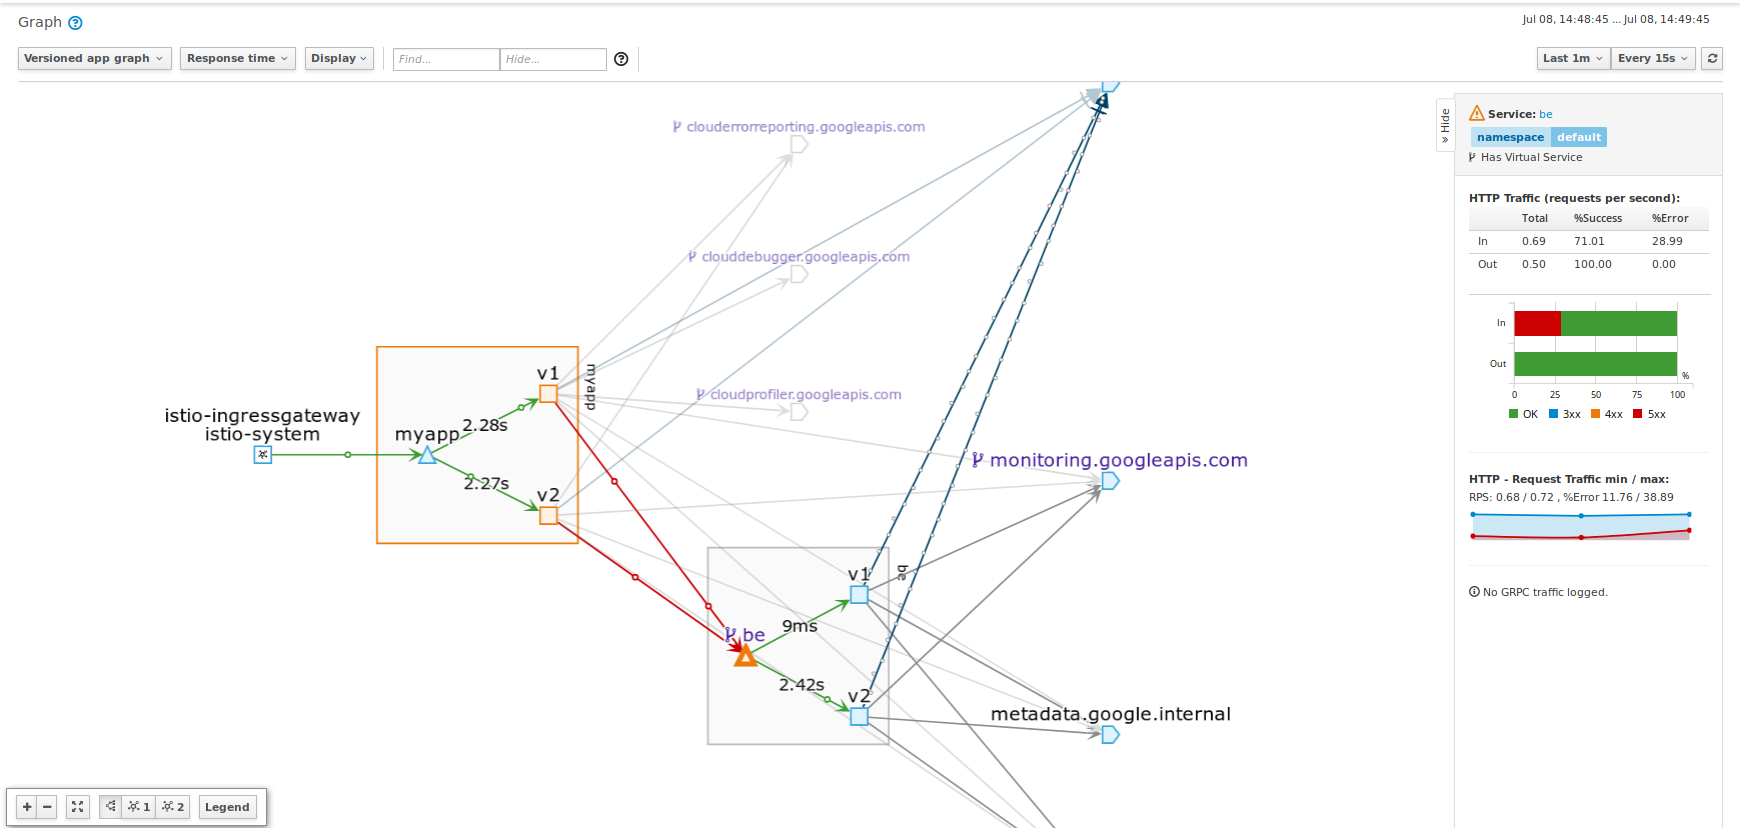
fev1v2->bev1v2 synthetic Errors
Now inject a synthetic fault into the picture. Istio allows you to setup a ‘fake’ latency or error through its Falutl Injection mechanism.
Edit
istio-fev1-bev1v2.yamland setbe*to invent 30%500synthetic errors
apiVersion: networking.istio.io/v1alpha3
kind: VirtualService
metadata:
  name: be-virtualservice
spec:
  gateways:
  - mesh
  hosts:
  - be
  http:
  - route:
    - destination:
        host: be
        subset: v1
      weight: 50
    - destination:
        host: be
        subset: v2
      weight: 50
    fault:
      abort:
        percent: 30
        httpStatus: 500
Then see:
for i in {1..1000}; do curl -sk -w "\n" -s http://$GATEWAY_IP/backend &&  sleep 1; done

Response from Backend: This is a response from Backend be-v1-77f6fff764-g5tl4 running version 1
Response from Backend: This is a response from Backend be-v1-77f6fff764-g5tl4 running version 1
Response from Backend: fault filter abort
Response from Backend: This is a response from Backend be-v2-7c4566bc4b-2kfq7 running version 2
Response from Backend: This is a response from Backend be-v1-77f6fff764-g5tl4 running version 1
Response from Backend: fault filter abort
Response from Backend: fault filter abort
Response from Backend: This is a response from Backend be-v1-77f6fff764-g5tl4 running version 1
Response from Backend: This is a response from Backend be-v1-77f6fff764-g5tl4 running version 1
Response from Backend: This is a response from Backend be-v1-77f6fff764-g5tl4 running version 1
Response from Backend: This is a response from Backend be-v1-77f6fff764-g5tl4 running version 1
Response from Backend: This is a response from Backend be-v2-7c4566bc4b-2kfq7 running version 2
Response from Backend: fault filter abort
Observe these errors in Kiali
fev1v2->bev1v2 path based routing
You can continue this technique with other endpoints and even do path based routing.
For example you can define a rule which forces /backend to only go to be:v1. For more information on that, see istio helloworld Route Control
The following section will cover how stackdriver helps surface more details to what was just done
LOGGING
Since we enabled structured logging,
import (
  log "github.com/sirupsen/logrus"
)
...
	log.SetFormatter(&log.JSONFormatter{
		DisableTimestamp: true,
		FieldMap: log.FieldMap{
			log.FieldKeyLevel: "severity",
		},
	})
	log.SetOutput(os.Stdout)
	log.SetLevel(log.InfoLevel)
A log entry like the following:
log.Printf("Found ENV lookup backend ip: %v port: %v\n", backendHost, backendPort)
Will get emitted as structured to stdout
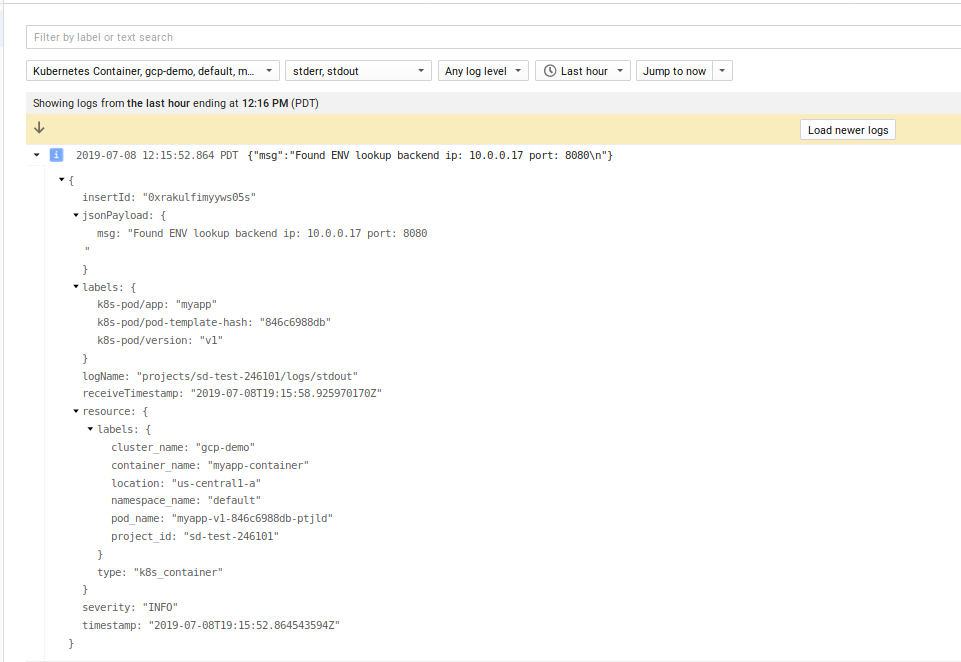
What is not shown is structured, correlated logging or the httpRequest proto. For more information on that, see
TRACING
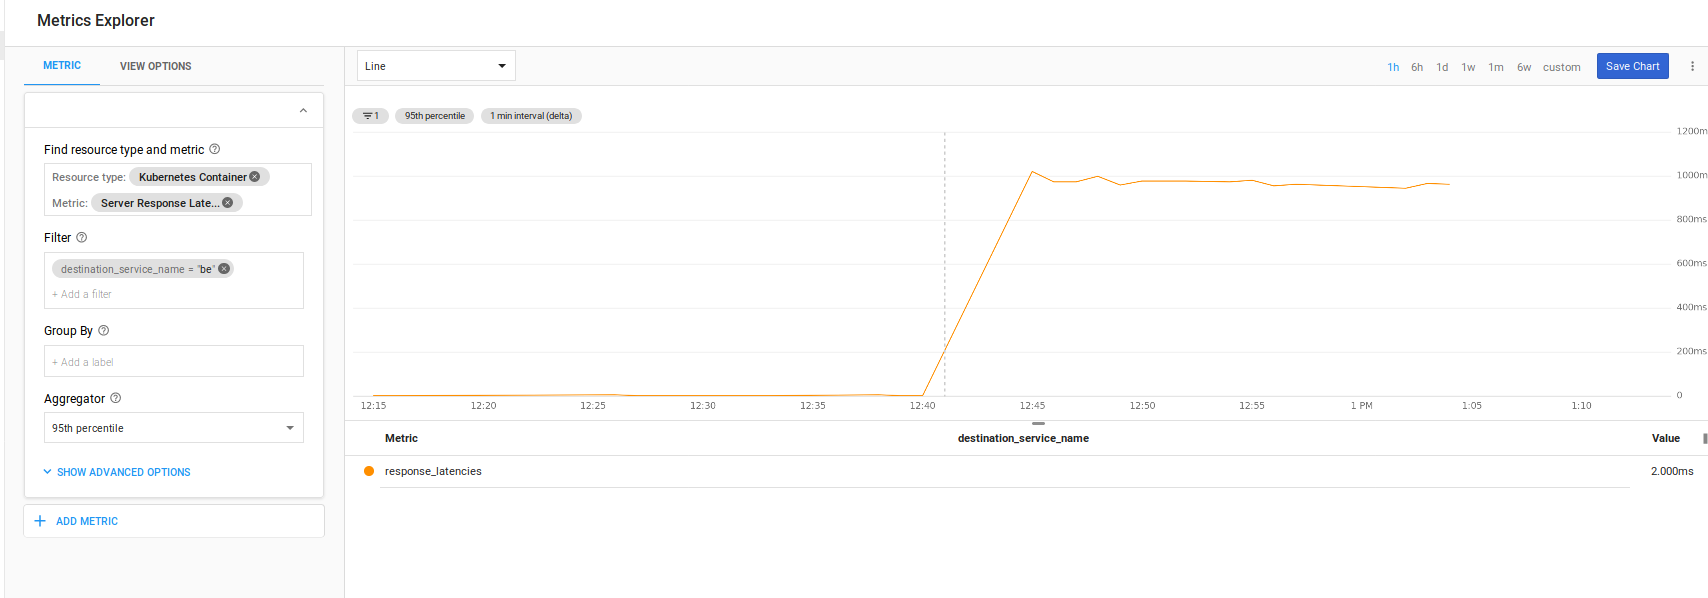
Tracing was enabled directly on the cluster so all istio statistics gets emitted. You can see the default trace capability built in here:
The following just shows the latency we added on directly to /backend:
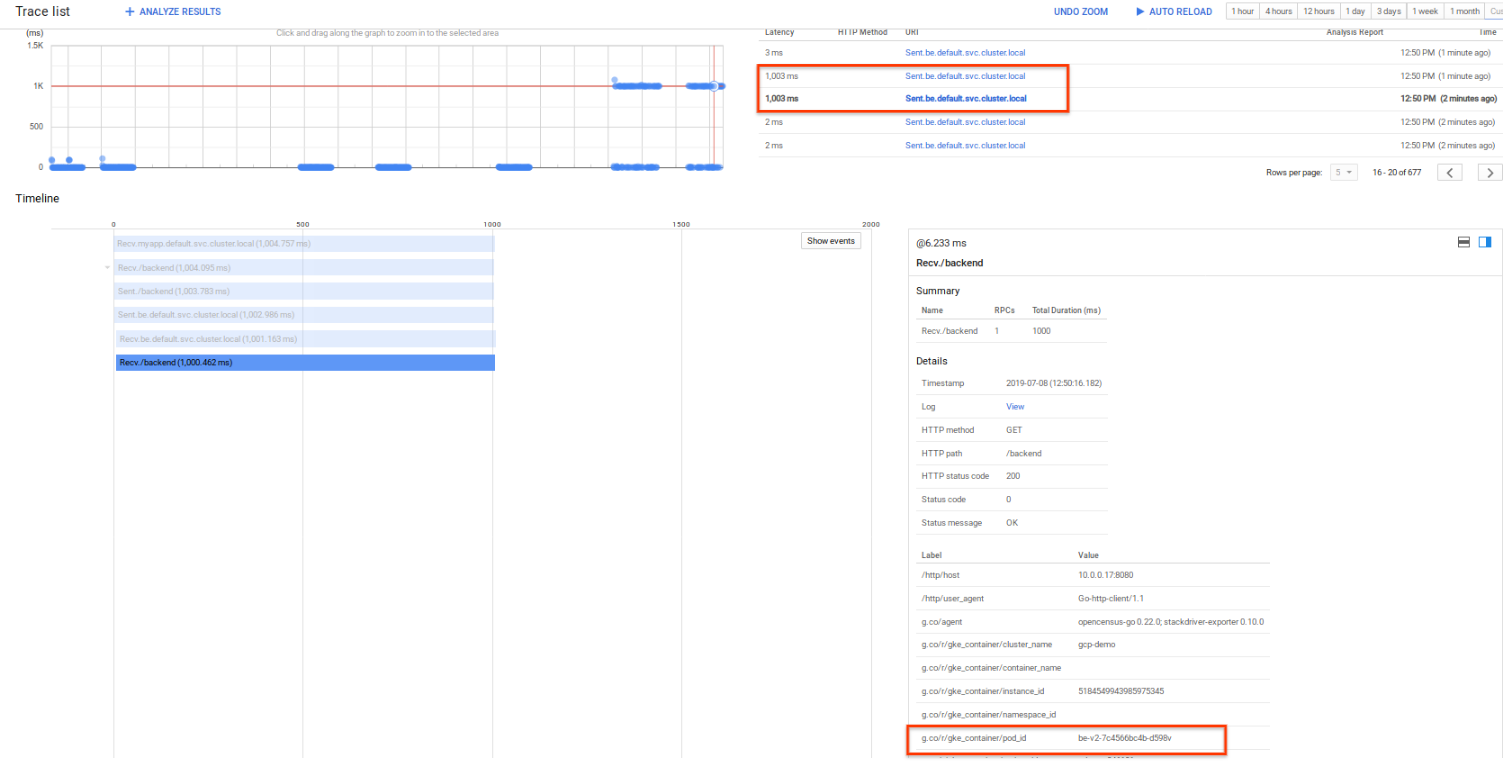
However, we also enabled the /tracer backend to emit ‘in context’ traces. That is, we will emit custom spans from a frontend to the backend within the same span
For example
fe:/tracer: start span, retrieve a file from GCS, make a call to thebe:/tracerbe:/tracer: start span, retrieve a file from GCS, respond back to the frontend
WHat we ill see is the actual API request, spans TO GCS as well as the custom spans we setup
Now invoke the /tracer endpoint ont the frontend
for i in {1..5}; do curl -sk -w "\n" -s http://$GATEWAY_IP/tracer && sleep 1; done
You’ll see the full request flow described above
user->fev1v2(start span, make gcs api call, make request call to backend)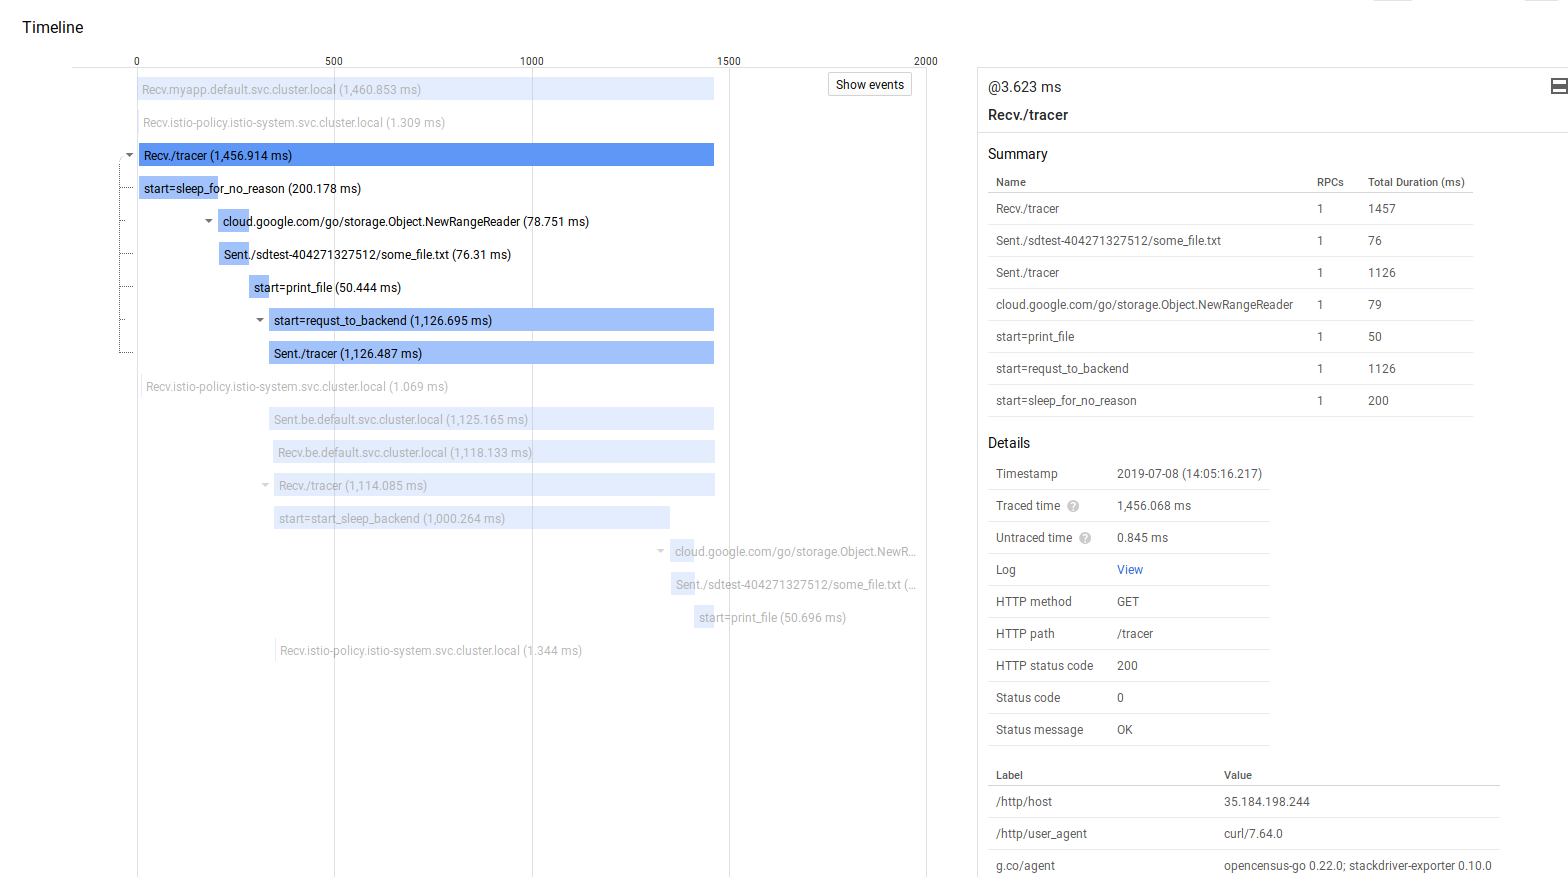
then on the same parent psan
fe->bev1v2(continue span, make gcs api call, return)
For more information see Google Cloud Trace context propagation and metrics graphs with Grafana+Prometheus and Stackdriver
Spans
If you want to start a span, just set the start/end:
	// Start Span
	_, fileSpan := trace.StartSpan(ctx, "start=print_file")

	time.Sleep(50 * time.Millisecond)
	fileSpan.End()
	// End Span
Propagation
If you want to propagate a trace from a frontend to backend, you need to bake in the context with the request:
	client := &http.Client{
		Transport: &ochttp.Transport{},
	}

	hreq, _ := http.NewRequest("GET", fmt.Sprintf("http://%v:%v/", backendHost, backendPort), nil)

	// add context to outbound http request
	hreq = hreq.WithContext(cc)
	rr, err := client.Do(hreq)
Trace->Log Linking
You can also link a given trace directly with a logEntry. Unfortunately, you need to emit logs using the Cloud Logging API and not stdout as described in this repo. If you instead emitted logs and specified the trace field in the LogEntry proto as shown here
  ctx := span.SpanContext()
  tr := ctx.TraceID.String()
  lg := client.Logger("spannerlab")
  trace := fmt.Sprintf("projects/%s/traces/%s", projectId, tr)
  lg.Log(logging.Entry{
  Severity: severity,
  Payload:  fmt.Sprintf(format, v...),
			Trace:    trace,
			SpanID:   ctx.SpanID.String(),
		})
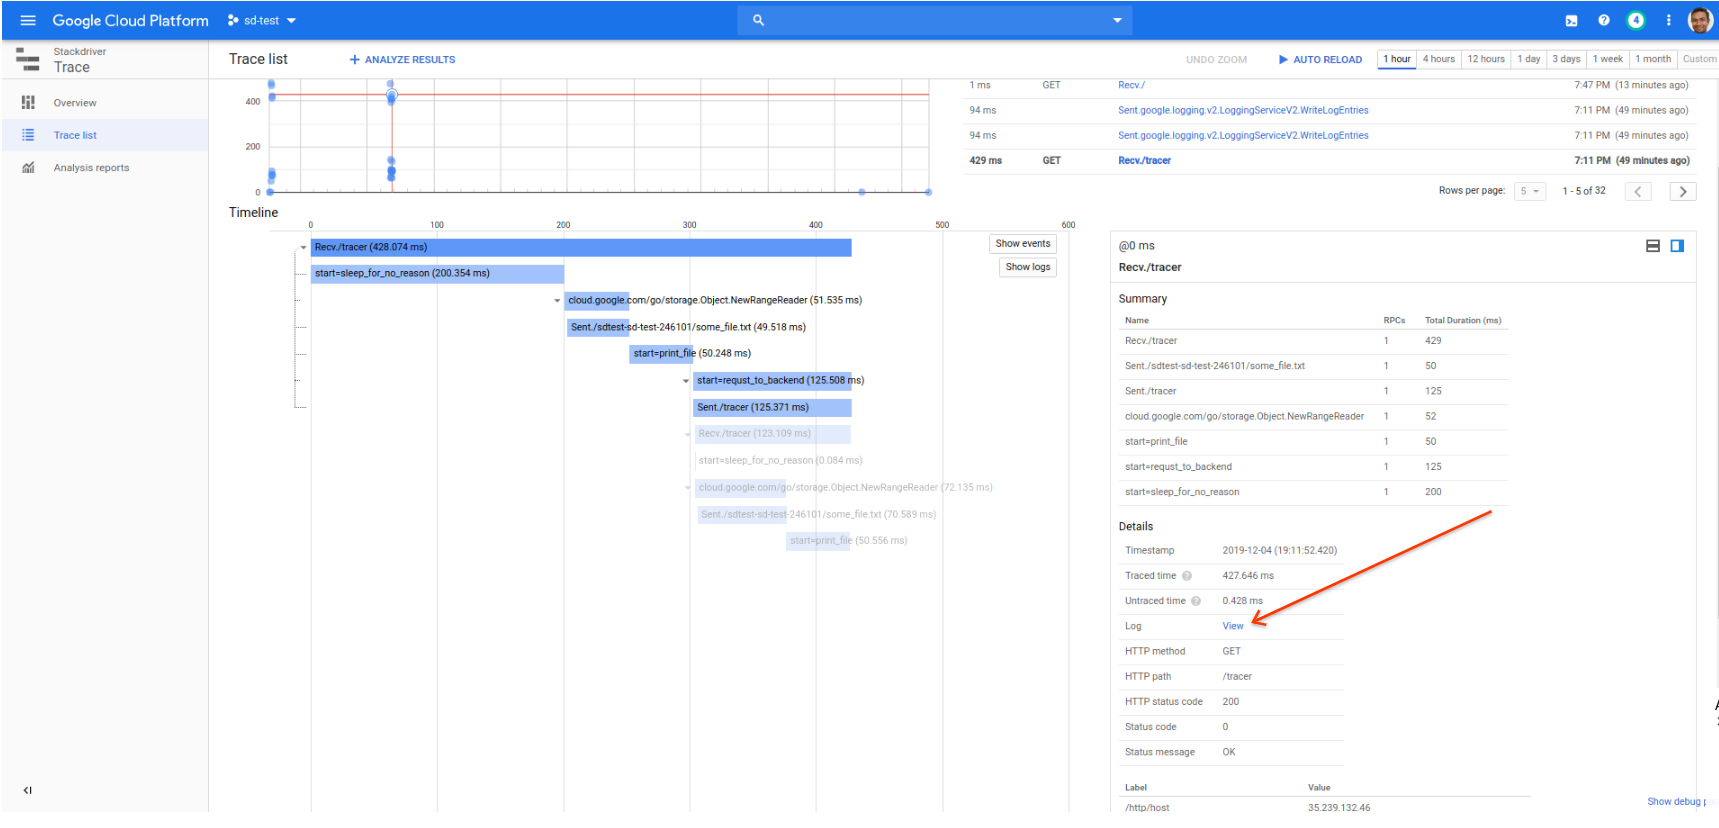
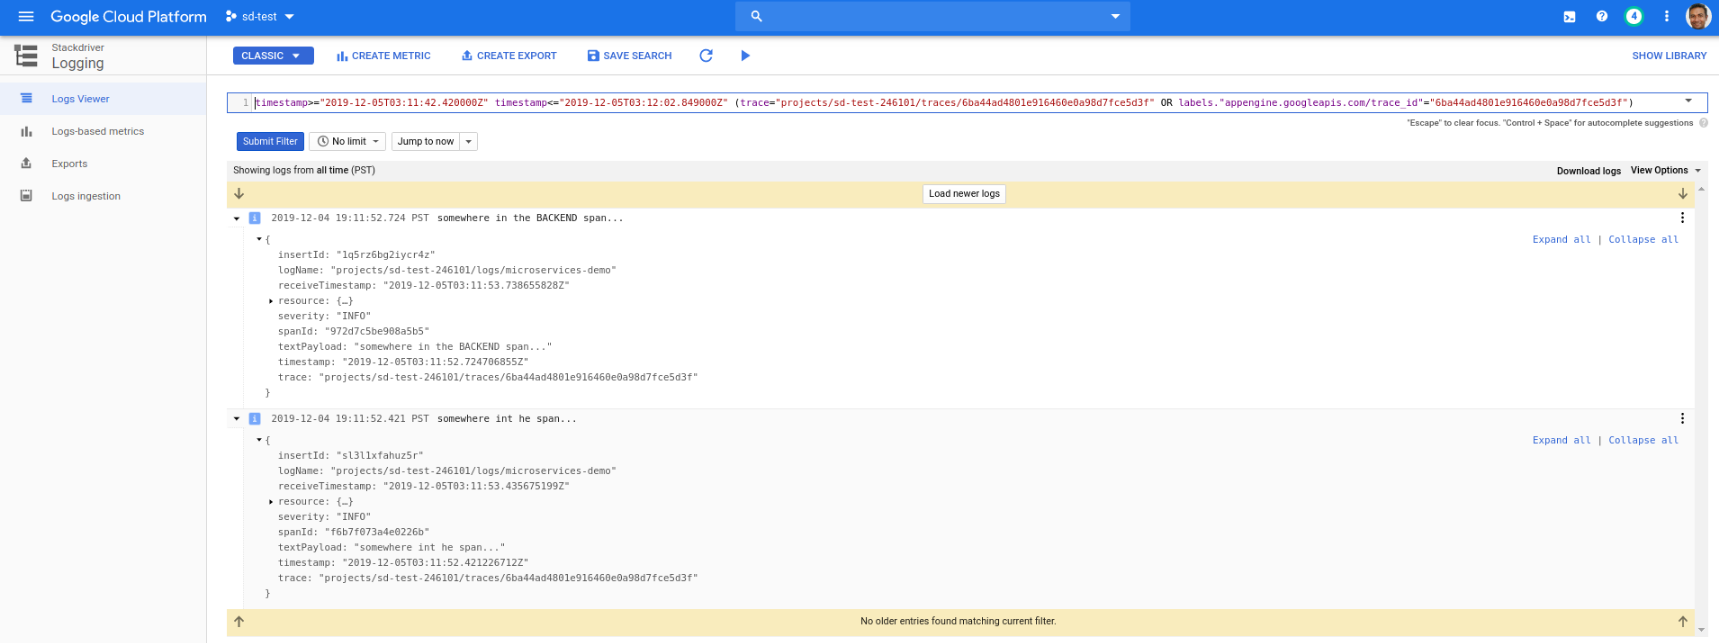
You can see the log lines for a given trace
The snippet above can be wrapped inside a function as shown in applog.go contained within this repo:
import (
applog "github.com/salrashid123/minimal_gcp/applog"
)
...
...
applog.Initialize(os.Getenv("GOOGLE_CLOUD_PROJECT"))
defer applog.Close()
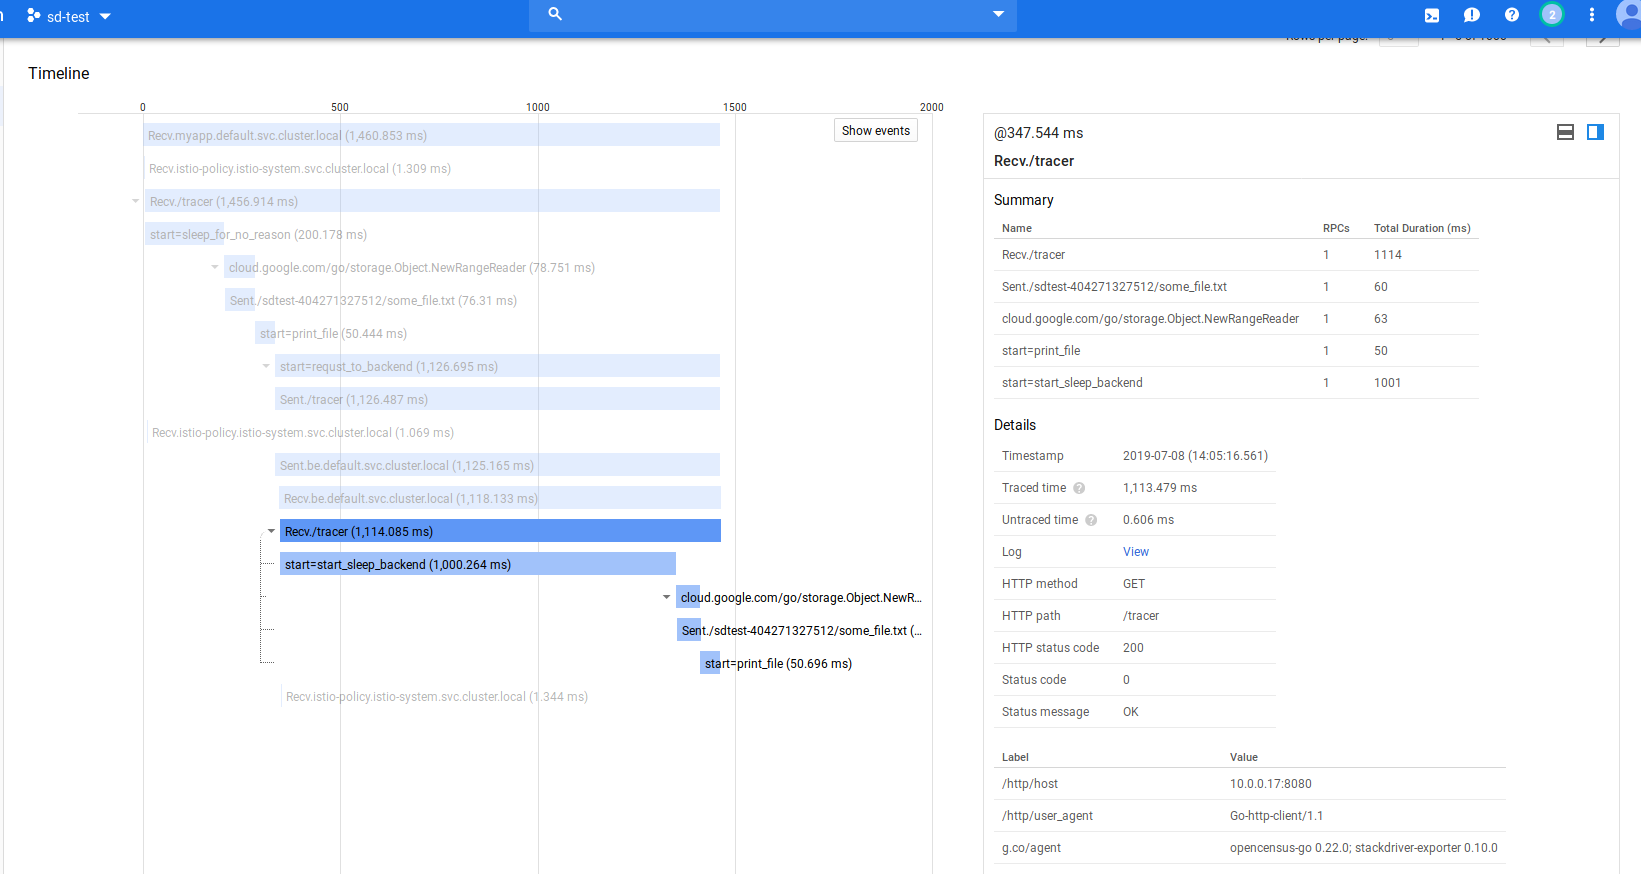
// Start Span
_, sleepSpan := trace.StartSpan(ctx, "start=start_sleep_backend")
sctx, sleepSpan := trace.StartSpan(ctx, "start=sleep_for_no_reason")
applog.Printf(sctx, "somewhere in the BACKEND span...")
if version == "2" {
log.Infof("...just doing nothing for... 1000ms")
time.Sleep(time.Duration(1000) * time.Millisecond)
}
sleepSpan.End()
// End Span
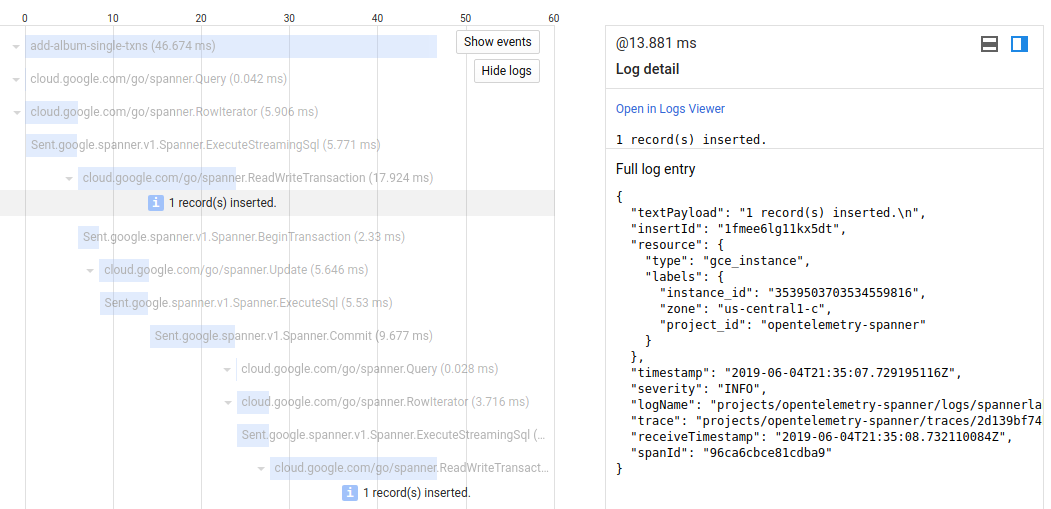
As another example, a /tracer request emits an log line within a span in both the frontend and backend application. The net result is the “View” link for the given trace shows both the log lines emitted within that trace:
Parent-Child Log Linking
Its convenient to display all the log lines associated with a single request as one grouped log. That is, if you emit N log lines within one httpRequest, you can ’expand’ the parent http request log entry and see the subentries. This is not available with the default logs to stdout on GKE nor is it available by default with the LoggingAPI. Instead, you need to carefully construct the log entries in a specific sequence where the parent includes the httpRequest proto and child logs are linked with the traceID. For more information, see Correlating Log Lines on GCP
Metrics
There are two sections to monitoring here:
- Built in Stackdriver monitoring for istio
- Custom metrics
Built in SD metrics
Stackdriver provides automatic monitoring of certain istio statistics. In our case, if saw that in the Kiali console but alertable via SD:
More more details on alerting based on Istio and SD metrics, please see the istio samples
Custom Metrics
The sample here uses Opencensus libraries to emit metrics as well. What this allows you do to is to emit any arbitrary custom metric to any target supported. The exporter we use here is ofcourse Stackdriver.
The configuration below describes a custom metric called demo/simplemeasure that has a dimension of path and describes a simple counter
	mCount     = stats.Int64("Count", "# number of called..", stats.UnitNone)
	keyPath, _ = tag.NewKey("path")
	countView  = &view.View{
		Name:        "demo/simplemeasure",
		Measure:     mCount,
		Description: "The count of calls per path",
		Aggregation: view.Count(),
		TagKeys:     []tag.Key{keyPath},
  }
We set this up in middleware
func trackVistHandler(next http.Handler) http.Handler {
	return http.HandlerFunc(func(w http.ResponseWriter, r *http.Request) {
		defer func() {
			ctx, err := tag.New(context.Background(), tag.Insert(keyPath, r.URL.Path))
			if err != nil {
				log.Println(err)
			}
			stats.Record(ctx, mCount.M(1))
		}()
		next.ServeHTTP(w, r)
	})
}
that intercepts every request to the /measure endpoint
http.Handle("/measure", trackVistHandler(measureHandler))
So..what does that custom metric do? Well, its a trivial example: all it does is increments a counter for every request to the /measure endpoint (or more accurately, any endpoint but we only enabled the interception for /measure). The metric essentially says “create a custom metric that counts something and allow me to filter it on an label “path”. So if i enabled any other endpoint like http.Handle("/backend", trackVistHandler(backendHandler)), i would end up with a custom metric where i could see this counter and then filter it on the path (since i emit r.URL.Path as its label value)
Using a counter for visits to an endpoint is contrived (you could just use builtin metrics) but this demonstrates any custom attribute you can emit
- listing custom metrics Now that we have custom metric defined, you can list it using the monitoring.projects.metricDescriptors.list endpoint.
Apply the filter to recall the metric set here
metric.labels.path="/measure" AND resource.type="gke_container" AND metric.type="custom.googleapis.com/opencensus/demo/simplemeasure"
- listing timeseries
You can list the timeseries using the API explorer (just rest the timespan and the project name)
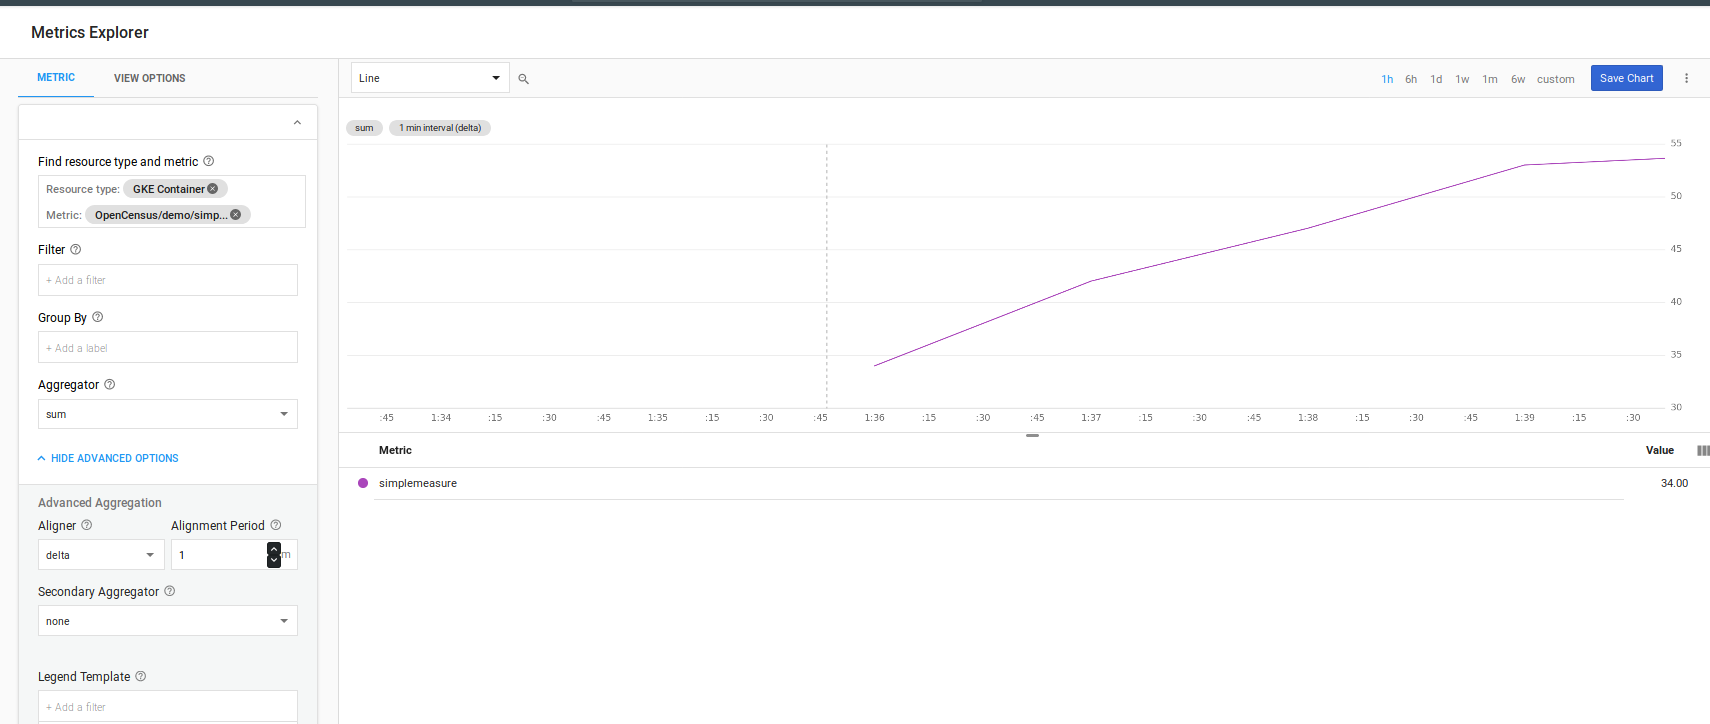
The custom metric renders as:
{
 "timeSeries": [
  {
   "metric": {
    "labels": {
     "path": "/measure"
    },
    "type": "custom.googleapis.com/opencensus/demo/simplemeasure"
   },
   "resource": {
    "type": "gke_container",
    "labels": {
     "container_name": "",
     "namespace_id": "default",
     "instance_id": "2504921965430513151",
     "zone": "us-central1-a",
     "pod_id": "myapp-v1-846c6988db-96cbx",
     "project_id": "sd-test-246101",
     "cluster_name": "gcp-demo"
    }
   },
   "metricKind": "CUMULATIVE",
   "valueType": "INT64",
   "points": [
    {
     "interval": {
      "startTime": "2019-07-08T03:59:42.720343Z",
      "endTime": "2019-07-08T04:15:42.720367Z"
     },
     "value": {
      "int64Value": "16"
     }
    },
    {
     "interval": {
      "startTime": "2019-07-08T03:59:42.720343Z",
      "endTime": "2019-07-08T04:14:42.720435Z"
     },
     "value": {
      "int64Value": "16"
     }
    },
Ofcourse you can plot that after sending some traffic to the /mesure endpoint:
for i in {1..100}; do curl -sk -w "\n" -s http://$GATEWAY_IP/measure && sleep 1; done
Debugger and Profiler
If you deploy the Debug image and redeploy, you will enable the Stackdriver Profiler and Debugger
edit istio-deployment.yaml
apiVersion: extensions/v1beta1
kind: Deployment
metadata:
  name: myapp-v1
spec:
  replicas: 1
  template:
    metadata:
      labels:
        app: myapp
        version: v1
    spec:
      serviceAccountName: myapp-sa
      containers:
      - name: myapp-container
        #image: gcr.io/sd-test-246101/fe_min:1
        image: gcr.io/sd-test-246101/fe_min:debug1
        imagePullPolicy: Always
I do not recommend this on production traffic but if you need to setup a small sample to profile, debug with (see section on selective traffic allocation)
Profiling
Profiler takes sometime to gather the data but eventually you will see
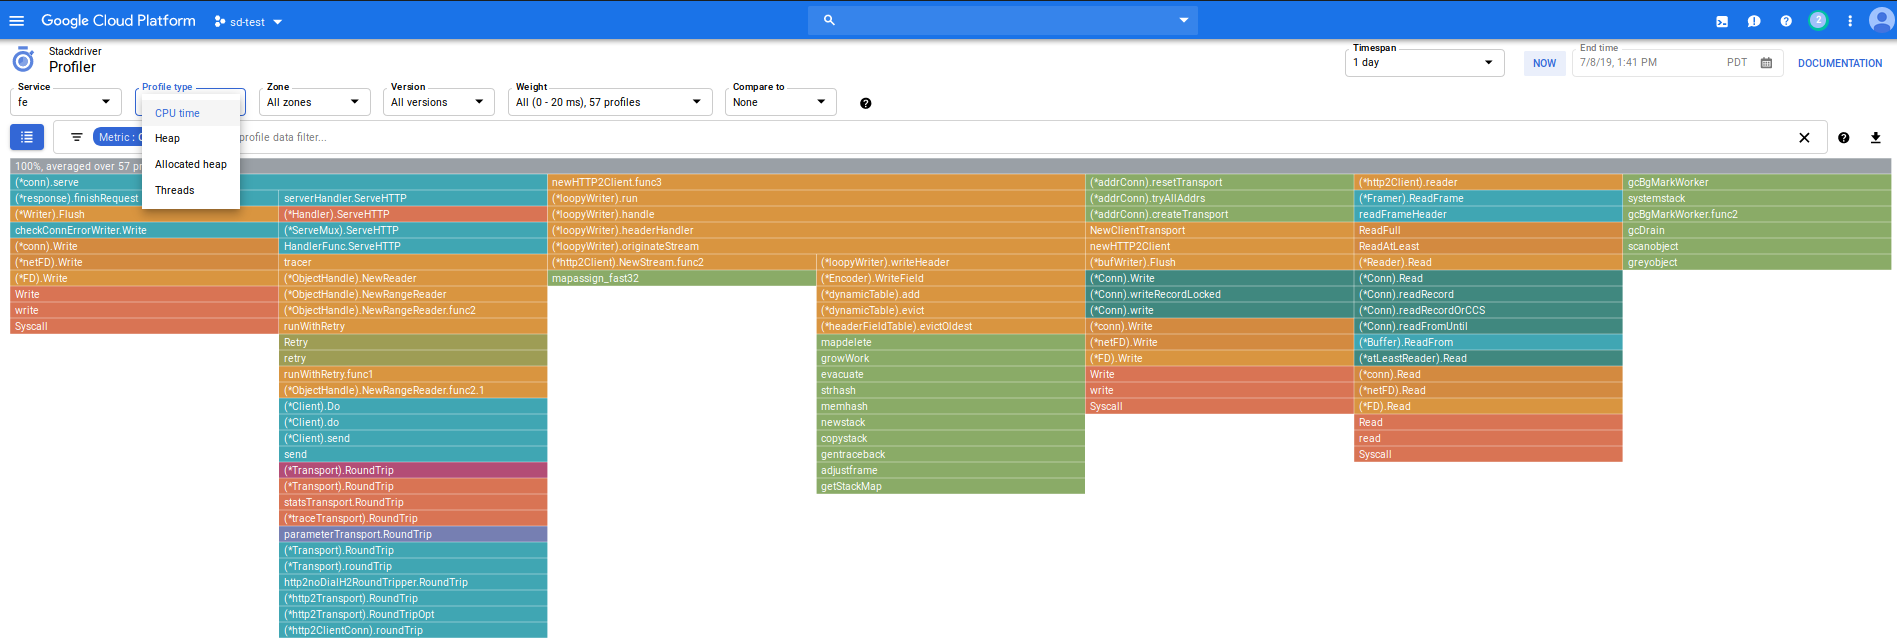
Which you can use to filter on cpu,heap, thread and other aspects of your running app
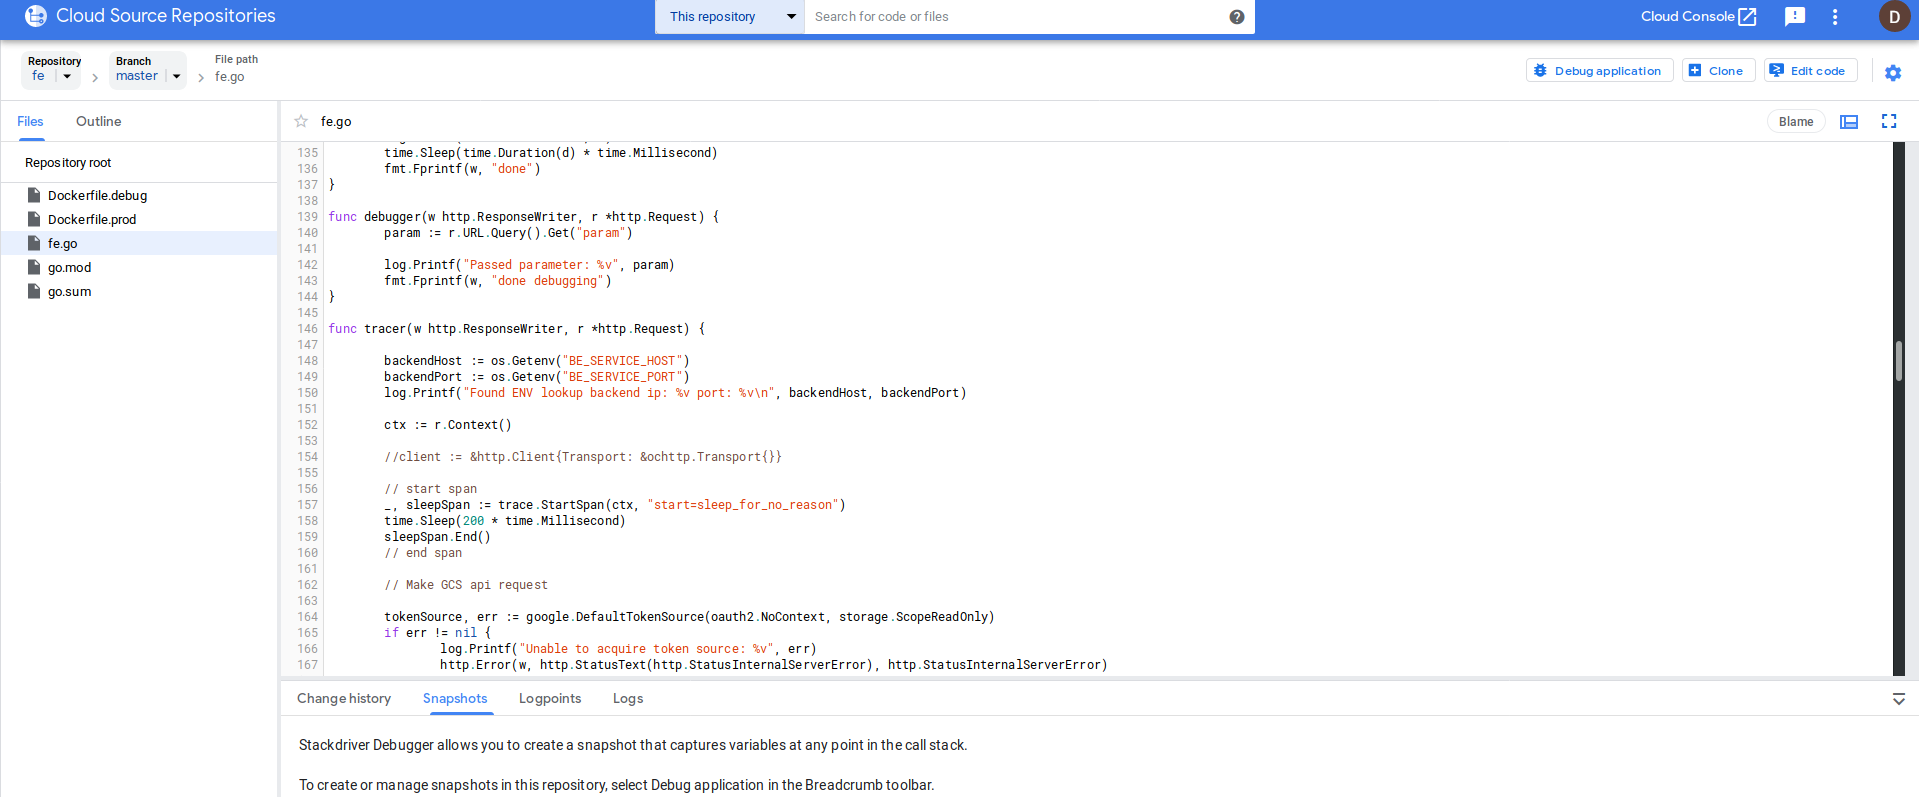
DEBUGGING
Cloud debugger allows you to inspect and inject log lines into your code. It does not stop execution!
You will have to enable instrumentation on startup so its use isn’t recommended on production traffic (only small portion, if its really necessary)
- as of
7/8/19, cloud debugger portion of this repo is not working due to the way profiler/debugger starts up on Istio issue#119
I’ll update this repo once that is resolved with actuall deebugger usage…for now, just a screenshot!
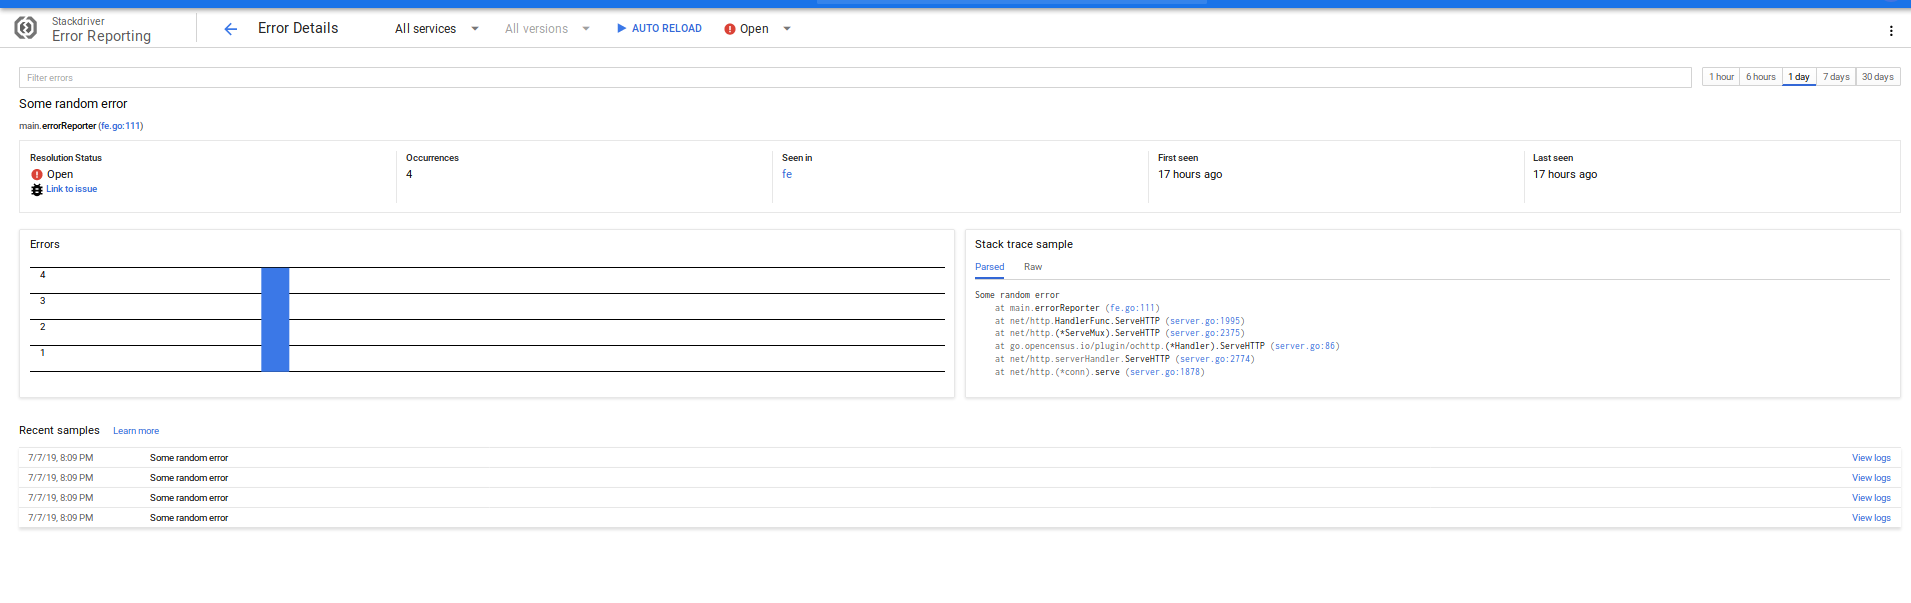
ERROR REPORTING
Cloud Error Reporting is enabled on all versions (not just debug!). You can invoke it by going to the /error endpoint on the frontend.
The specific type of error that is being emitted is a golang customer error
type CustomError struct {
	Code    int
	Message string
}
func NewCustomError(code int, message string) *CustomError {
	return &CustomError{
		Code:    code,
		Message: message,
	}
}
func (e *CustomError) Error() string {
	return e.Message
}
WHich is directly invoked
	errorClient, err = errorreporting.NewClient(ctx, os.Getenv("GOOGLE_CLOUD_PROJECT"), errorreporting.Config{
		ServiceName: "fe",
		OnError: func(err error) {
			log.Printf("Could not log error: %v", err)
		},
	})
	err := NewCustomError(500, "Some random error")
	errorClient.Report(errorreporting.Entry{
		Error: err,
	})
and renders in the console as:
Cleanup
Delete the cluster, gcs bucket, cloud source repo
Conclusion
Thats it…that was a lot of ground to cover. The intent of this was to provide a minimal sample that you can play around with…but at the end of the exercise, its still a lot…but its a lot to cover anyway. If you see any improvements, please let me know under the issues section.
Appendix
Kaili patch
Adds Kaili to the default installation of gke+istio
    cd istio_install
    export ISTIO_VERSION=1.1.7
    curl https://storage.googleapis.com/gke-release/istio/release/$GKE_ISTIO_VERSION/patches/install-prometheus.yaml
    | kubectl apply -n istio-system -f -
    wget https://github.com/istio/istio/releases/download/$ISTIO_VERSION/istio-$ISTIO_VERSION-linux.tar.gz
    tar xvzf istio-$ISTIO_VERSION-linux.tar.gz

    helm template --set kiali.enabled=false --namespace istio-system istio-$ISTIO_VERSION/install/kubernetes/helm/istio > off.yaml
    helm template --set kiali.enabled=true --set dashboard.username=admin --set dashboard.passphrase=admin --namespace istio-system istio-$ISTIO_VERSION/install/kubernetes/helm/istio > on.yaml
    diff -u off.yaml on.yaml > kiali.patch
    ```

    - edit kiali.path  [ accept all diffs ], or apply the one attached to this repo
This site supports webmentions. Send me a mention via this form.