Request Annotation with Cloud Audit Logging and Monitoring on GCP
2021-08-04Snippets demonstrating a simple way to embed/associate audit logged metadata to GCP API calls.
Or in other words, whenever you make any GCP API call like GCS, PubSub, you can automatically attach metadata to the call which will show up in audit logs. One usecase is to attach information about why the request is being made. For example, if you run a SaaS service that uses GCP APIs and you make calls to services on behalf of your customers, you can attach information to that call indicating who it was made for.
Also included in this repo is the basic ‘helloworld’ for OpenCensus. With this, you can also emit a metric/counter to any exporter OpenCensus supports that indicates who the call is for. Basically, you can have a metric that shows requests/second or any other metric per customer.
Logging
Sending optional metadata to any GCP API call is actually already there but just not advertized:
Simply send the metadata string with the hidden X-Goog-Request-Reason header
thats is. Just use that header which isn’t documented anywhere.
Infact, Cloud libraries, gcloud cli and even Terraform already supports that parameter
For gcloud its an environment variable or config value
$ export CLOUDSDK_CORE_REQUEST_REASON="fooo"
# or
$ gcloud config set core/request_reason foo

# then
$ gcloud secrets versions access 1 --secret="dbpassword"
for terraform, its just an env var (i’ll file a feature request for terraform to get this in as a module parameter..)
$ export CLOUDSDK_CORE_REQUEST_REASON="fooo"
$ terraform apply
In golang, when you initialize the client, simply define option.WithRequestReason():
client, err := storage.NewClient(ctx, option.WithRequestReason(reason))
Since these entries show up in audit logs, first enable them:
Since the
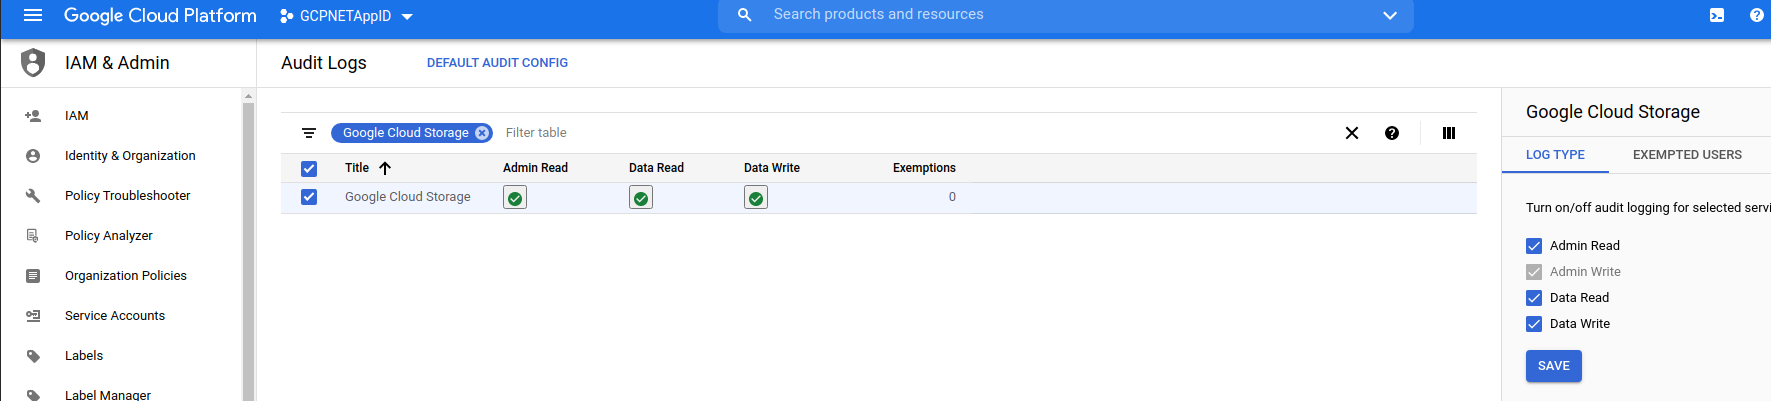
Once you send in the header, take a look at the structured payload data in the audit logs:
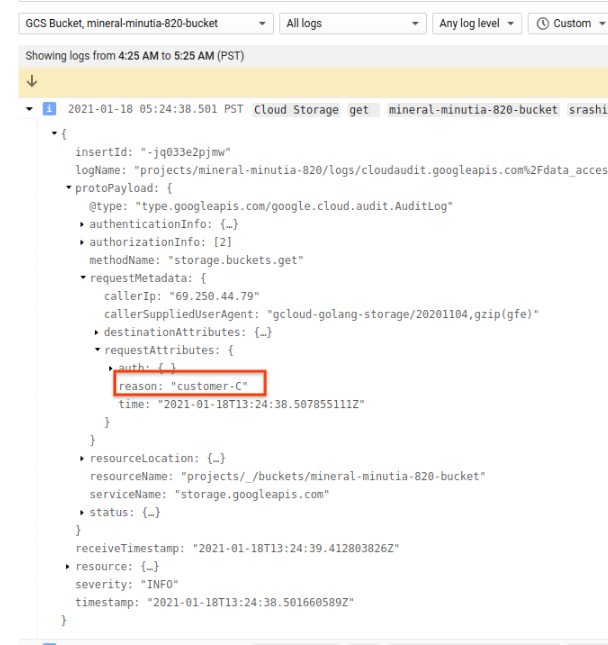
From there, you can even define Log to Metrics as a counter value.
Or…if you just want to use curl:
curl -H "Authorization: Bearer `gcloud auth print-access-token`" -H "X-Goog-Request-Reason:  fooo" \
	  https://storage.googleapis.com/storage/v1/b/mineral-minutia-820-bucket
The protos defining this parameter is in audit_log.proto: RequestMetadata.request_attributes –> attribute_context.proto Request.reason
One thing to point out is each client you initialize will reuse the same reason. Meaning, if you initialize a client, set the reason and then use the client for N API calls for different customer, they will all be attached to the same reason. You can override per rpc but its a bit awkward to setup. The following is one implementation for PubSub using gRPC: per RPC Request Reason
Monitoring
Similar to logging events per customer, a SaaS provider may also want to emit metrics per customer. In the following trivial sample, we will emit a counter simulating a customer request handled and then render the data using prometheus and Grafana.
The snippet is nothing new, its just the ‘helloworld’ of Opencensus.
Code provided in monitoring/main.go will run numerous go routines for all customers and then 3minutes in, a spike in a single customer requests.
To use
Start prometheus and grafana:
docker run \
    --net=host \
    -p 9090:9090 \
    -v `pwd`/prometheus.yml:/etc/prometheus/prometheus.yml \
    prom/prometheus


docker run --net=host -p 3000:3000 grafana/grafana
Launch the Grafana console, (default username/password is admin/admin).
Configure grafana for a prometheus datasource
goto
 http://localhost:3000  admin/admin
 configuration=>datasources
   Select `Prometheus`
    Name: `envoy`
    URL: `http://localhost:9090/`
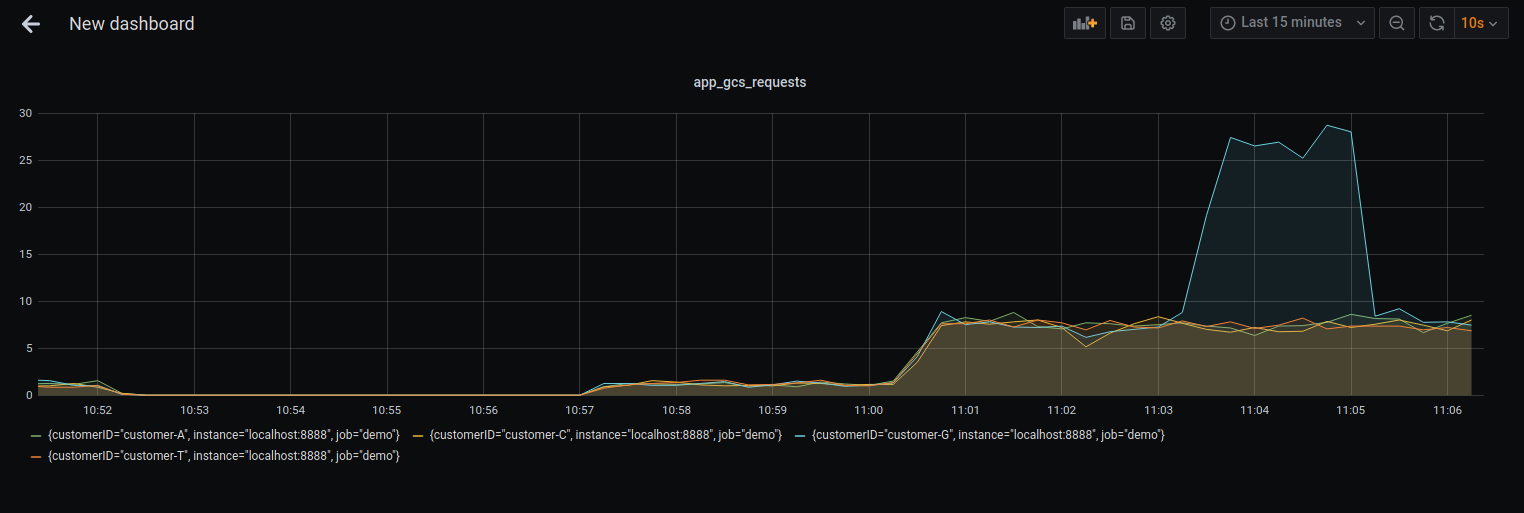
then graph the metric apps_gcs_requests using rate():
Note tht there was a sudden spike in requests sent in by customer-G
also see
gRPC per method observability with envoy, Istio, OpenCensus and GKE
This site supports webmentions. Send me a mention via this form.