Distributed HTTP Proxy on Google Cloud using Terraform
2022-05-01Terraform module that allows you to easily create HTTP CONNECT proxies in different Google Cloud Regions.
Once deployed, you can send traffic from your laptop through remote host by just setting the http_proxy= environment variable proxy (kinda like nordVPN).
There are two modes of operation:
-
HTTP ProxyIn this mode, the client connects to Envoy usingHTTP Connectmechanism and requests an upstream connection to the server. Envoy Proxy establishes a socket to the remote and proxies the TCP Traffic between the client and server. At no time can Envoy inspect the encrypted TLS traffic between the client and server -
TLS ProxyIn this mode, the client establishes a TLS connection to Envoy and Envoy then creates a new tls socket with the server. Envoy continues to inspect and proxy the TLS session. This mode does not use HTTP Connect and each client must trust the TLS certificate presented by Envoy.
this repo is NOT supported by Google Cloud Support
You can find the source here Distributed HTTP Proxy on Google Cloud using Terraform
other references
Setup
These terraform scripts will:
- Create a new GCP Project
- Create a regional network loadbalancer in the regions you specify
- Create an instance template which runs a Container Optimized VM without external IPs and deploys Envoy Proxy
- Create a managed instance group as a backend service
- Create a NAT Gateway to route traffic from the MIG
Since we’re setting up a new GCP Project, you must of course have the ability to create a new project.
First edit variables.tf and set
# envoy will only proxy requests intended for this host
# all other requests will get rejected.  (todo: allow more hosts)
variable "allowed_host" {
  type    = string
  default = "httpbin.org"
}

# set this to the billing account you have access to
variable "billing_account" {
  type    = string
  default = "000C16-9779B5-123456"
}

# set this to your
variable "org_id" {
  type    = string
  default = "673208781234"
}

# a list of regions where individual proxy instance groups will get created
# in the example below, a separate proxy cluster will get setup in
# three different regions with three different regional load balancers
variable "regions" {
  type    = list(string)
  default = ["us-central1","us-east1"]
}

# this is the ip address rages that are allowed to invoke the proxy
variable "allowedIP" {
  type    = list(string)
  default = ["72.83.22.111/32"]
}
HTTP Proxy
As mentioned, to use this mechanism, you can usually set the http_proxy= environment variable.
client -->
   Regional Network LoadBalancer
     --> AutoScaled Managed Instance Group
        --> Container Optimized OS running Envoy
            --> Envoy creates TCP Tunnel to Server
                --> Server
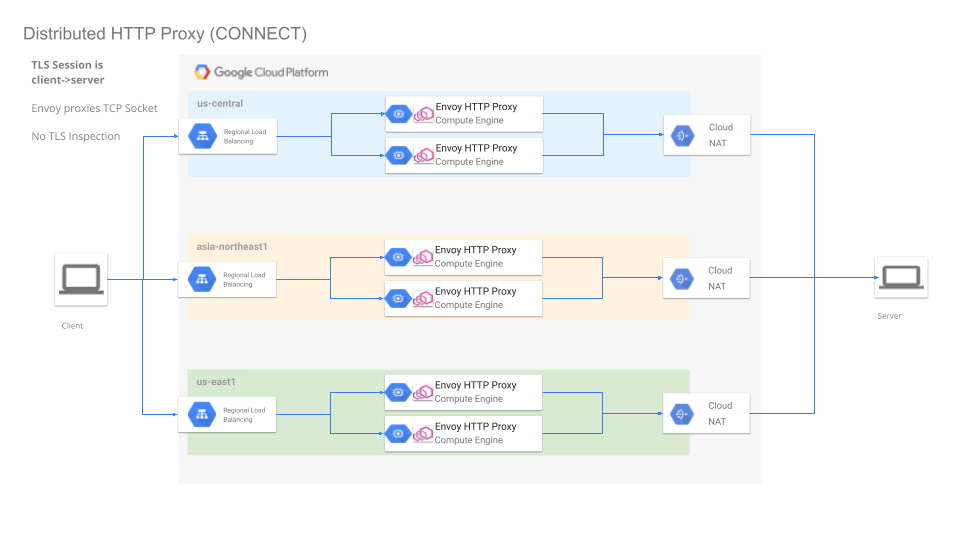
Envoy as CONNECT proxy
To deploy
cd proxy
terraform init
terraform apply
You will see output which shows the regions where the proxy is deployed and the cardinal loadbalancer IP addresses
Outputs:

allowedIP = tolist([
  "72.83.22.111/32",
])
lb_ip = [
  "35.202.89.73",
  "34.148.151.53",
]
project_id = "ts-3646c73be292f8fb"
project_number = "1090542778209"
regions = tolist([
  "us-central1",
  "us-east1",
])
Wait maybe 3 minutes for the LB programming to settle and propagate and then invoke the loadbalancer using the external IP
$ curl -s -x 35.202.89.73:3128 -L https://httpbin.org/get
{
  "args": {},
  "headers": {
    "Accept": "*/*",
    "Host": "httpbin.org",
    "User-Agent": "curl/7.81.0",
    "X-Amzn-Trace-Id": "Root=1-626fcc52-545e32134476d2f06360e3e1"
  },
  "origin": "104.198.241.231",
  "url": "https://httpbin.org/get"
}

$ curl -s -x34.148.151.53:3128 -L https://httpbin.org/get
{
  "args": {},
  "headers": {
    "Accept": "*/*",
    "Host": "httpbin.org",
    "User-Agent": "curl/7.81.0",
    "X-Amzn-Trace-Id": "Root=1-626fcc5f-7d3286707fc9de854aa4f17e"
  },
  "origin": "34.138.250.151",
  "url": "https://httpbin.org/get"
}
What the output shows is the JSON response from httpbin.org/get which just echos back the origin ip address it saw.
In the examples above, those are the cloud NAT ip addresses:
$ gcloud compute routers list --project ts-3646c73be292f8fb
NAME                REGION       NETWORK
router-us-central1  us-central1  default
router-us-east1     us-east1     default


$ gcloud compute routers get-nat-mapping-info router-us-central1 --project ts-3646c73be292f8fb --region=us-central1
---
instanceName: vm-qtcv
interfaceNatMappings:
- natIpPortRanges:
  - 104.198.241.231:1024-1055

$ gcloud compute routers get-nat-mapping-info router-us-east1 --project ts-3646c73be292f8fb --region=us-east1
---
instanceName: vm-6klr
interfaceNatMappings:
- natIpPortRanges:
  - 34.138.250.151:1024-1055
If you want to proxy different hosts, you must edit the envoy configuration to allow those.
TODO: allow dynamic config
TLS Proxy
In this mode, you are not using HTTP CONNECT and instead Envoy acts as a normal man in the middle proxy with full traffic TLS decoding.
client -->
   Regional Network LoadBalancer
     --> AutoScaled Managed Instance Group
        --> Container Optimized OS running Envoy
            --> Envoy terminates client TLS session
              --> Envoy creates new TLS
                --> Server
This ofcourse requires each client to trust the TLS CA that envoy runs and appropriate DNS/host resolution. This mode should be very rare.
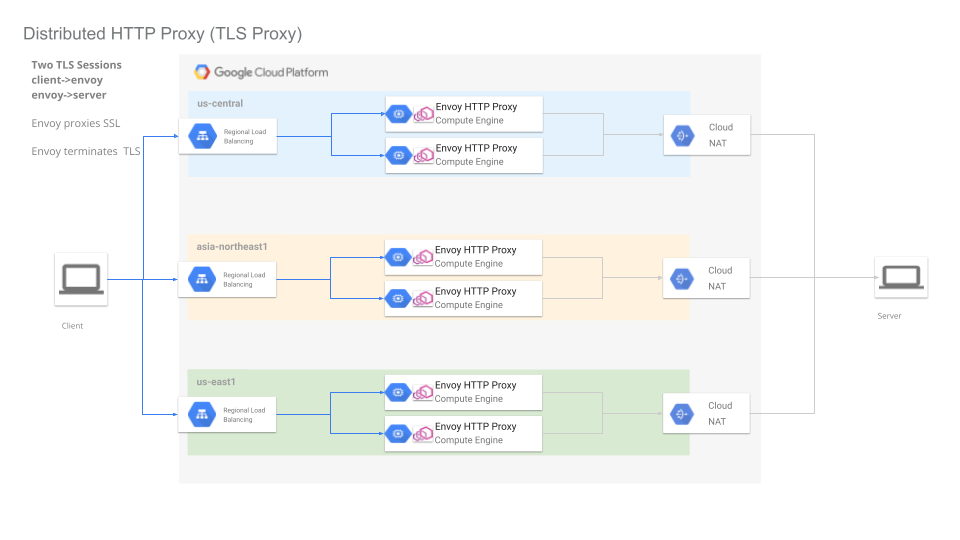
Envoy as TLS proxy
To deploy this, edit the variables.tf per the instructions above and then
cd tls/
terraform init
terraform apply
The output will show the Regional LB ranges allocated. For example:
allowedIP = tolist([
  "72.83.22.111/32",
])
lb_ip = [
  "35.202.212.160",
  "34.74.158.204",
]
project_id = "ts-5dcad0707ba3fbf9"
project_number = "89351627456"
regions = tolist([
  "us-central1",
  "us-east1",
])
Now invoke the LB endpoint as if its the target service
$  curl -vvvvv   -H "Host: httpbin.org"   --resolve  httpbin.org:443:35.202.212.160  --cacert certs/tls-ca.crt   https://httpbin.org/get


< HTTP/1.1 200 OK
< date: Mon, 02 May 2022 13:01:42 GMT
< content-type: application/json
< content-length: 303
< server: envoy
< access-control-allow-origin: *
< access-control-allow-credentials: true
< x-envoy-upstream-service-time: 120
<
{
  "args": {},
  "headers": {
    "Accept": "*/*",
    "Host": "httpbin.org",
    "User-Agent": "curl/7.81.0",
    "X-Amzn-Trace-Id": "Root=1-626fd636-00e1547f0a64d0971e44ba48",
    "X-Envoy-Expected-Rq-Timeout-Ms": "15000"
  },
  "origin": "35.239.54.238",
  "url": "https://httpbin.org/get"
}
A couple of things to note:
- we rerouted host resolution for
httpbin.orgto the loadbalancer address - allowed curl to trust the CA certificate issued by a self-signed CA
x-envoy-upstream-service-timeis a default header returned by envoy which tell the client ‘how long envoy took to get the full request-response stream from httpbin`. This is really useful since it shows you how much latency the services has from the region.
This repo uses a self-issued CA. You can issue your own CA using CA Scratchpad. Remember to set the various SAN values
Observability
You can also do a small amount of monitoring on the proxy cluster you’re running
Envoy Access Logs
Envoy runs with its access logging enabled to stdout.
What that will show is the basic access logging for HTTP traffic like this:
For the http_proxy, you wont’ ofcourse see much info at all other than the initial CONNECT request
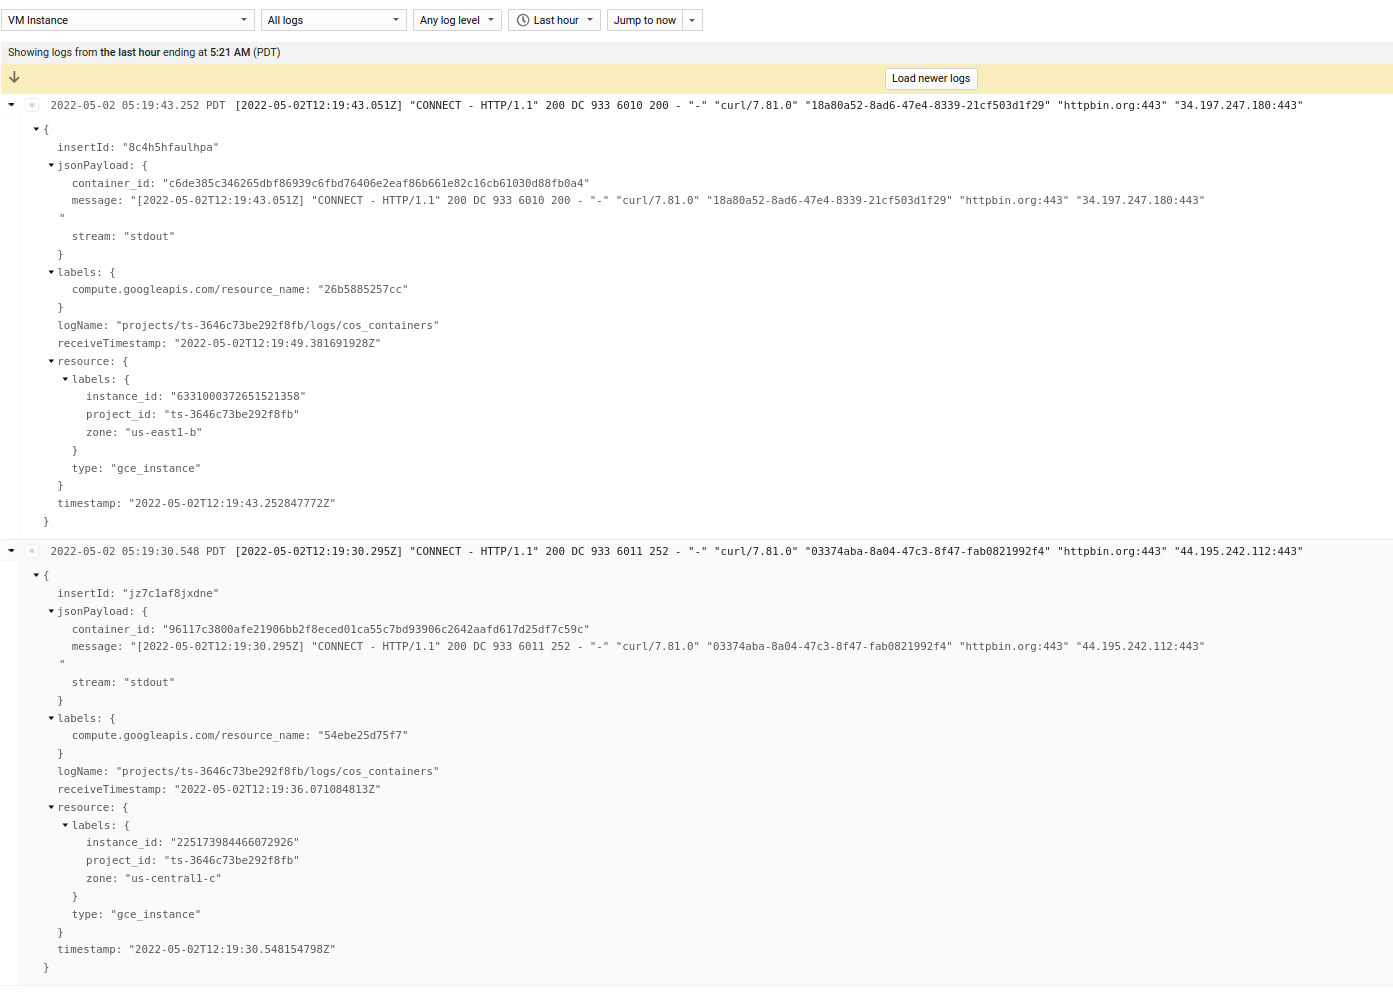
Envoy CONNECT logs
Note, if you are using the TLS proxy, you will actually see the query string within the TLS request (in this case the path /get)
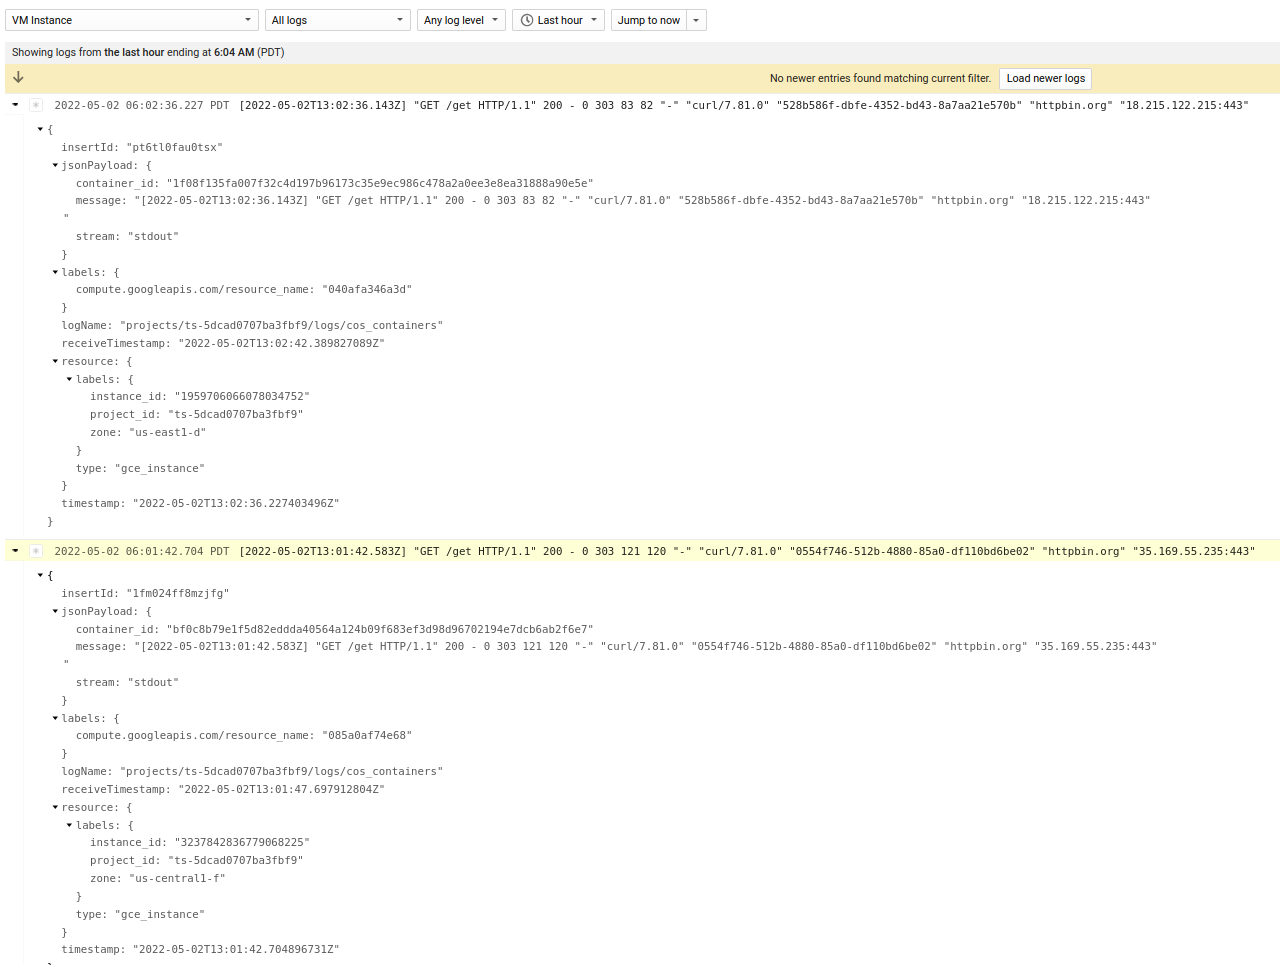
Envoy TLS Proxy logs
Prometheus and Grafana
Envoy also has a built in Prometheus endpoint which you can hook into to recieve envoy cluster statistics
You an hook prometheus to Grafana to visualize the data.
If you just want to test, you can run prometheus and grafana locally in docker. (this is just a demo…its not too feasible to do this locally)
The first step is to configure prometheus:
Edit prometheus.yml and set the endpoint targets to the public regional loadbalancer IP.
Of course note that by connecting to the loadbalancer IP address you are only connecting to ONE envoy instance in the managed group…but this is my demo and its just a demo
In our case for the CONNECT, the lb IPs were (“35.202.89.73”,“34.148.151.53”),
prometheus.yml
    static_configs:
    - targets: ['35.202.89.73:9000', '34.148.151.53:9000']
Now run a local prometheus instance
cd prometheus/
docker run \
    --net=host \
    -p 9090:9090 \
    -v `pwd`/prometheus.yml:/etc/prometheus/prometheus.yml \
    prom/prometheus
Verify the targets are running by going to http://localhost:9090/targets
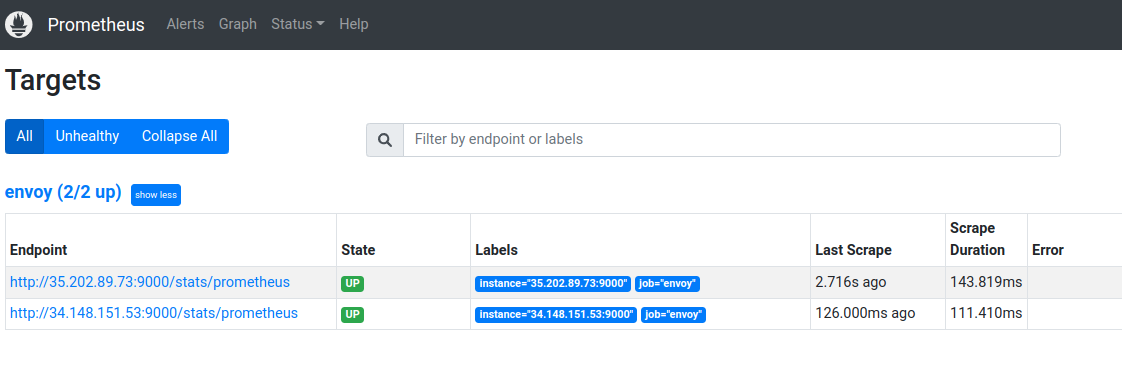
Prometheus targets
Now run Grafana locally
docker run --net=host -p 3000:3000 grafana/grafana
Access the Grafana screen locally at http://localhost:3000 (the default is admin/admin)
Once there, configure it to use Prometheus as a source:
Select Configuration -> Datasource.
Select Prometheus, set
the url to point to prometheus container: http://localhost:9090/
Click save and test.
Now create a dashboard, panel and use any statistic envoy publishes.
In my case, i picked the upstream connection count: upstream_cx_total
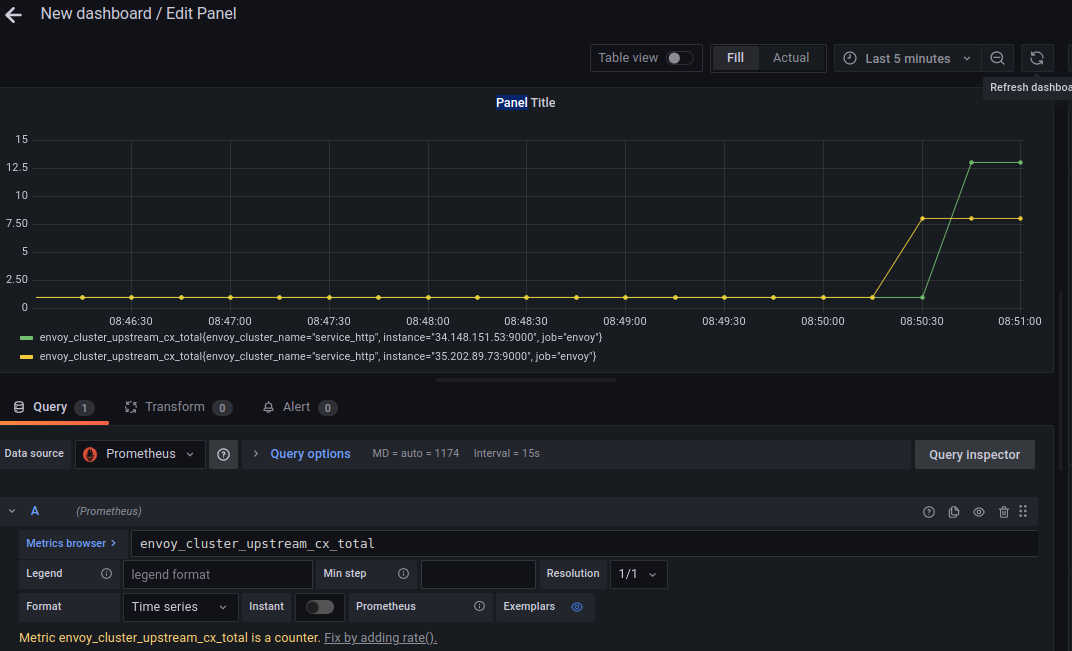
Grafana PROXY logs
You can see some details like histograms and response codes for the TLS proxy (since it knows about those)
eg, using histogram_quantile(0.95, sum(rate(envoy_cluster_external_upstream_rq_time_bucket[5m])) by (instance,le)). For example, for the TLS Proxy (which would know the per-path and HTTP response codes)
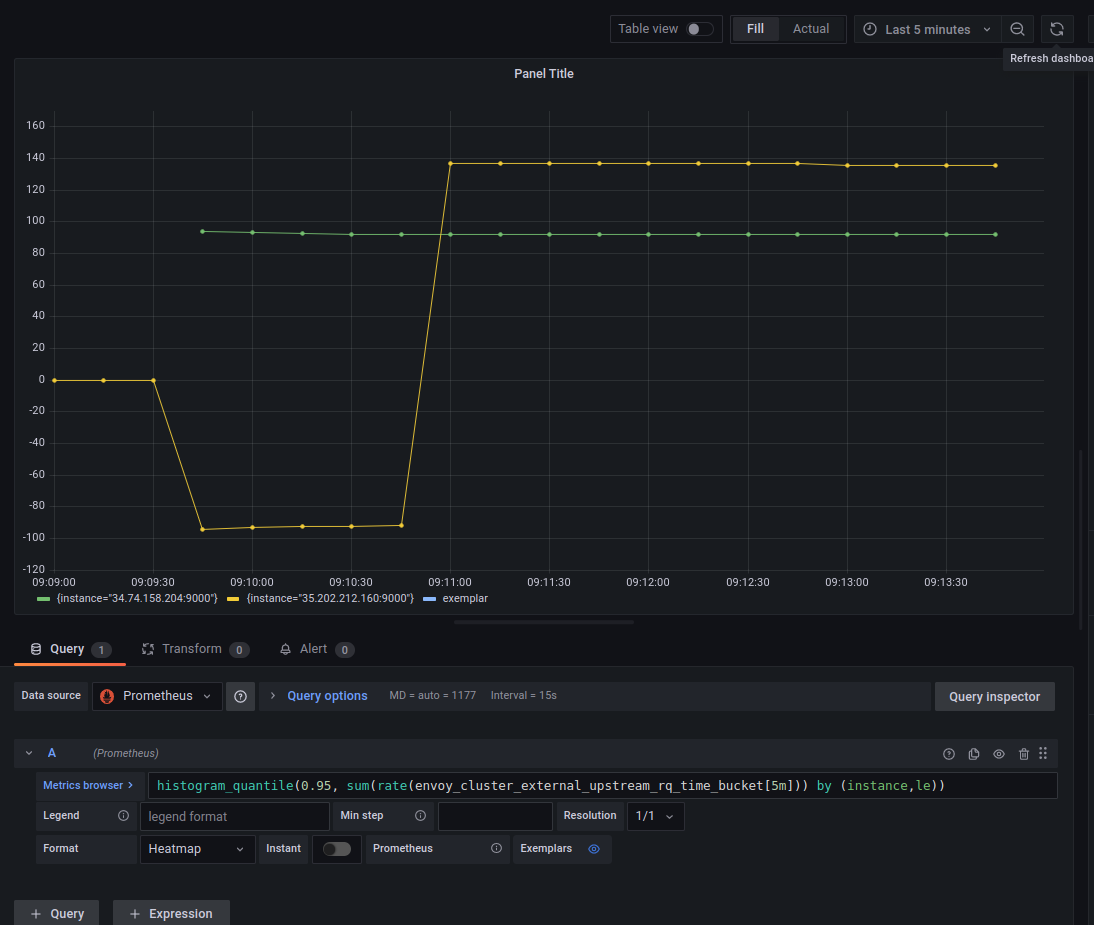
Grafana TLS Proxy logs
This site supports webmentions. Send me a mention via this form.