Monitoring GCP API Latency locally using Envoy
2022-01-07Sample envoy-prometheus-grafana setup you can run locally to monitor GCP gRPC API traffic statistics.
While Google Cloud offers a suite of monitoring tools and services, the data that is shown is aggregated across all clients and really shows API latency statistics once the request is received.
That is, customers can directly observe how a GCP API responds by setting up monitoring over the consumed_api metric as described in Creating a Dashboard with Stackdriver SLI Monitoring Metrics
The focus of this setup is different: monitor GCP API calls as viewed by an individual client from your laptop. Use this to test and observe latency as seen by an individual client.
There are several ways todo this ranging from
-
the really low level using
tcpdump: Using Wireshark to decrypt TLS gRPC Client-Server protobuf messages -
to using Envoy to fork, decrypt and monitor the response (Envoy TAP filter for gRPC)
-
to enabling an excruciating amount of logging and parsing timestamps from them (see gRPC Environment Variables)
-
to instrumenting code and emitting traces (see Google Cloud Trace context propagation and metrics graphs with Grafana+Prometheus and Stackdriver)
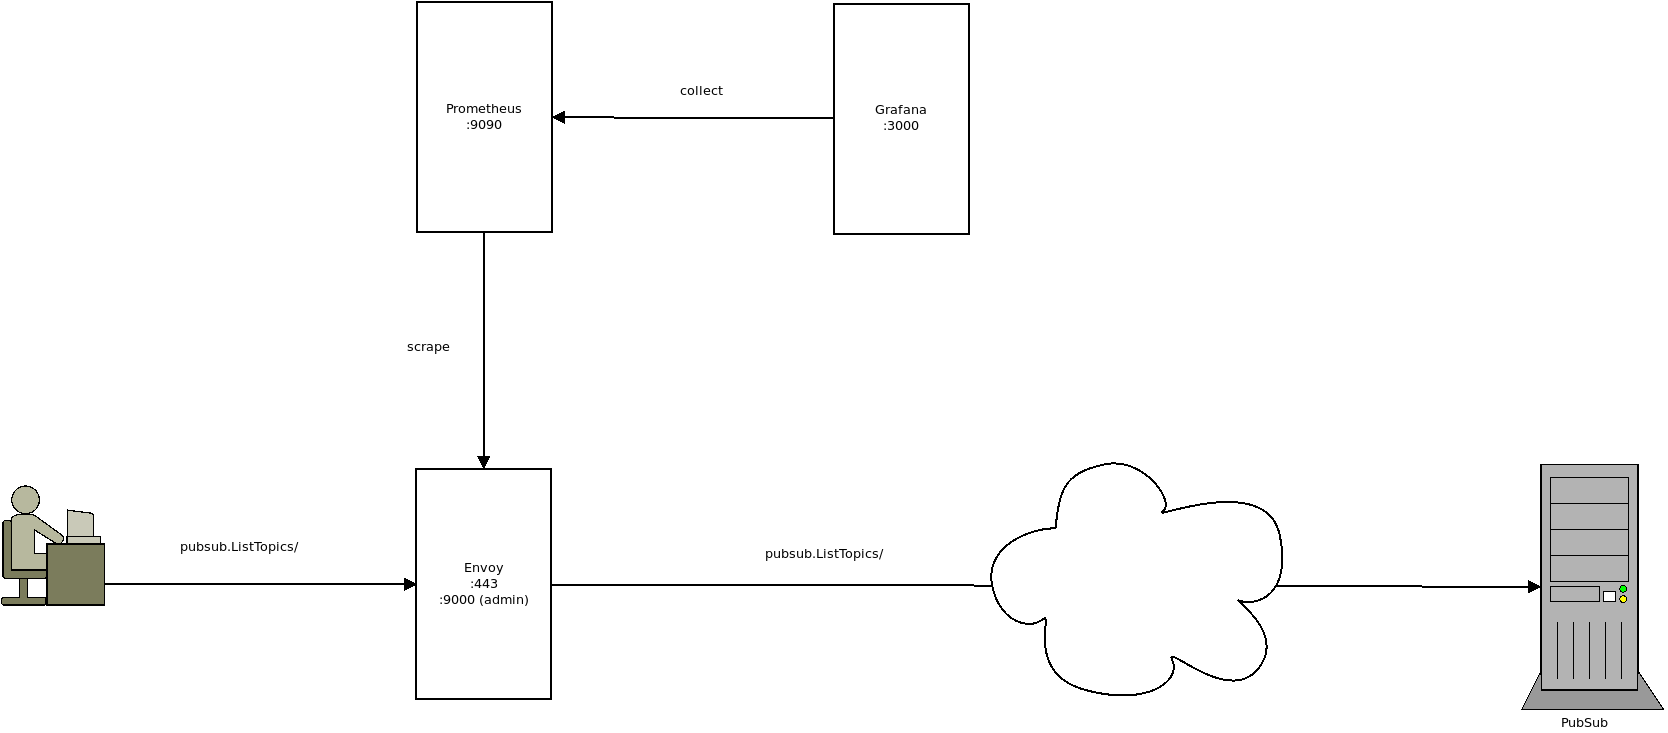
As mentioned, this repo takes the most ‘hands off’ approach to just seeing local statistics by using envoy to emit gRPC statistics which are consumable by prometheus. This article is a variation of what is described here in gRPC per method observability with envoy, Istio, OpenCensus and GKE
You can find the source here Monitoring GCP API Latency locally using Envoy
Setup
To get started, we will override the trust certificate store and /etc/hosts file so that clients “think” they’re talking to google when infact they’re communicating with envoy.
NOTE once you are done testing, please remember to remove the overrides shown below (both the trust CA and hosts file override!)
Override TLS CA
First thing is to override the TLS CA that the GCP client library uses. By default, it is the system root trust but we need to override that since envoy intercepts the traffic.
see Override Trust certificates for TLS for Google Cloud Client Libraries
Edit /etc/ssl/certs/ca-certificates.crt
Add the certificates shown in the appendix into that file
The first one is the root certificate and the second one is the TLS subCA that signed certs/googleapis.crt. Note that googleapis.crt has all the SNI values you could use for other services too.
Override /etc/hosts
Now override the hosts file on your local system to redirect traffic from your client intended for pubsub.googleapis.com to your localhost address where envoy is running
Edit /etc/hosts
127.0.0.1 pubsub.googleapis.com
Envoy docker container uses its own DNS resolver which means its not subject to this override and will contact pubsub proper.
Run Envoy
We are using a pretty recent version of envoy-in-a-container.
# build the local image using that as a base
docker build -t local_envoy .

# note docker is listening on a privleged port here
docker run -ti -p 443:8080  -p 127.0.0.1:9000:9000 local_envoy -c /etc/envoy/envoy.yaml -l info
Note that we enabled envoy’s built in gRPC statistics emitter:
          http_filters:
          - name: envoy.filters.http.grpc_stats
            typed_config:
              "@type": type.googleapis.com/envoy.extensions.filters.http.grpc_stats.v3.FilterConfig
              stats_for_all_methods: true
              enable_upstream_stats: true
That would show the gRPC statistics for clients traversing envoy for all filters.
Before we can see the gRPC statistics we are interested in, we need to run a client.
Run PubSub Client
First edit client/main.go and add in your projectID (you ofcourse need permissions to list topics in that project!)
Note that the script simply loops over every second indefinitely.
package main

import (
	"fmt"
	"time"

	pubsub "cloud.google.com/go/pubsub"
	"golang.org/x/net/context"
	"google.golang.org/api/iterator"
)

const (
	projectID = "your_project_id_here"
)

func main() {
	for {
		ctx := context.Background()
		pubsubClient, err := pubsub.NewClient(ctx, projectID)
		if err != nil {
			fmt.Printf("pubsub.NewClient: %v", err)
			return
		}
		defer pubsubClient.Close()

		pit := pubsubClient.Topics(ctx)
		for {
			topic, err := pit.Next()
			if err == iterator.Done {
				break
			}
			if err != nil {
				fmt.Printf("pubssub.Iterating error: %v", err)
				return
			}
			fmt.Printf("Topic Name: %s\n", topic.ID())
		}
		time.Sleep(1000)
	}
}
Also note that critically we have NOT changed anything in the code..thats the idea: we want to monitor the app without altering the trust certificates. (if you needed to do that, see the snippet in the appendix)
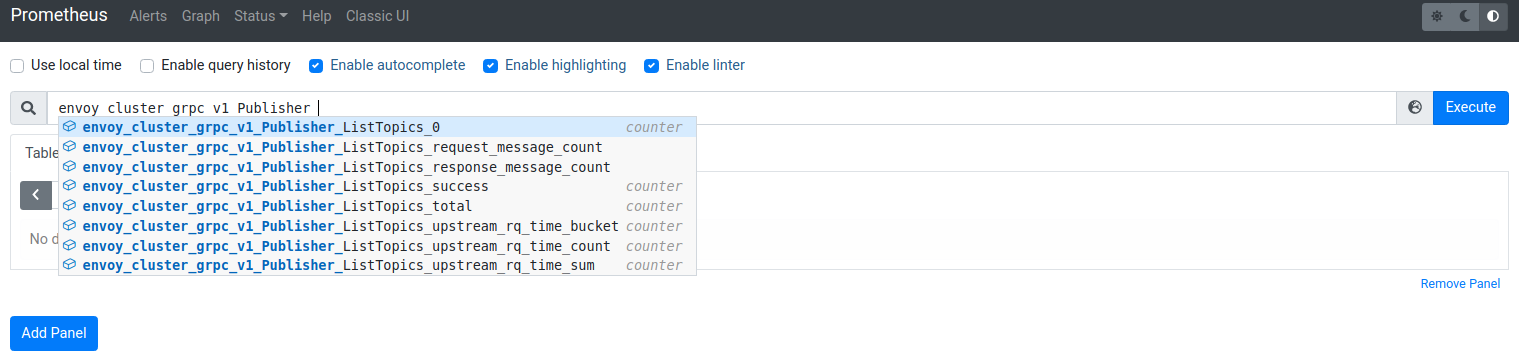
Once you send in some traffic, you can monitor the promethus endpoint within envoy by going to http://localhost:9000/stats/prometheus
You should see some gRPC Stats like the following
# TYPE envoy_cluster_external_upstream_rq_xx counter
envoy_cluster_external_upstream_rq_xx{envoy_response_code_class="2",envoy_cluster_name="service_pubsub"} 315

# TYPE envoy_cluster_grpc_v1_Publisher_ListTopics_0 counter
envoy_cluster_grpc_v1_Publisher_ListTopics_0{envoy_grpc_bridge_method="pubsub",envoy_grpc_bridge_service="google",envoy_cluster_name="service_pubsub"} 315

# TYPE envoy_cluster_grpc_v1_Publisher_ListTopics_request_message_count counter
envoy_cluster_grpc_v1_Publisher_ListTopics_request_message_count{envoy_grpc_bridge_method="pubsub",envoy_grpc_bridge_service="google",envoy_cluster_name="service_pubsub"} 316

# TYPE envoy_cluster_grpc_v1_Publisher_ListTopics_response_message_count counter
envoy_cluster_grpc_v1_Publisher_ListTopics_response_message_count{envoy_grpc_bridge_method="pubsub",envoy_grpc_bridge_service="google",envoy_cluster_name="service_pubsub"} 315

# TYPE envoy_cluster_grpc_v1_Publisher_ListTopics_success counter
envoy_cluster_grpc_v1_Publisher_ListTopics_success{envoy_grpc_bridge_method="pubsub",envoy_grpc_bridge_service="google",envoy_cluster_name="service_pubsub"} 315

# TYPE envoy_cluster_grpc_v1_Publisher_ListTopics_total counter
envoy_cluster_grpc_v1_Publisher_ListTopics_total{envoy_grpc_bridge_method="pubsub",envoy_grpc_bridge_service="google",envoy_cluster_name="service_pubsub"} 315


# TYPE envoy_cluster_grpc_v1_Publisher_ListTopics_upstream_rq_time histogram
envoy_cluster_grpc_v1_Publisher_ListTopics_upstream_rq_time_bucket{envoy_grpc_bridge_method="pubsub",envoy_grpc_bridge_service="google",envoy_cluster_name="service_pubsub",le="0.5"} 0
envoy_cluster_grpc_v1_Publisher_ListTopics_upstream_rq_time_bucket{envoy_grpc_bridge_method="pubsub",envoy_grpc_bridge_service="google",envoy_cluster_name="service_pubsub",le="1"} 0
envoy_cluster_grpc_v1_Publisher_ListTopics_upstream_rq_time_bucket{envoy_grpc_bridge_method="pubsub",envoy_grpc_bridge_service="google",envoy_cluster_name="service_pubsub",le="5"} 0
envoy_cluster_grpc_v1_Publisher_ListTopics_upstream_rq_time_bucket{envoy_grpc_bridge_method="pubsub",envoy_grpc_bridge_service="google",envoy_cluster_name="service_pubsub",le="10"} 0
envoy_cluster_grpc_v1_Publisher_ListTopics_upstream_rq_time_bucket{envoy_grpc_bridge_method="pubsub",envoy_grpc_bridge_service="google",envoy_cluster_name="service_pubsub",le="25"} 0
envoy_cluster_grpc_v1_Publisher_ListTopics_upstream_rq_time_bucket{envoy_grpc_bridge_method="pubsub",envoy_grpc_bridge_service="google",envoy_cluster_name="service_pubsub",le="50"} 0
envoy_cluster_grpc_v1_Publisher_ListTopics_upstream_rq_time_bucket{envoy_grpc_bridge_method="pubsub",envoy_grpc_bridge_service="google",envoy_cluster_name="service_pubsub",le="100"} 0
envoy_cluster_grpc_v1_Publisher_ListTopics_upstream_rq_time_bucket{envoy_grpc_bridge_method="pubsub",envoy_grpc_bridge_service="google",envoy_cluster_name="service_pubsub",le="250"} 293
envoy_cluster_grpc_v1_Publisher_ListTopics_upstream_rq_time_bucket{envoy_grpc_bridge_method="pubsub",envoy_grpc_bridge_service="google",envoy_cluster_name="service_pubsub",le="500"} 302
envoy_cluster_grpc_v1_Publisher_ListTopics_upstream_rq_time_bucket{envoy_grpc_bridge_method="pubsub",envoy_grpc_bridge_service="google",envoy_cluster_name="service_pubsub",le="1000"} 302
envoy_cluster_grpc_v1_Publisher_ListTopics_upstream_rq_time_bucket{envoy_grpc_bridge_method="pubsub",envoy_grpc_bridge_service="google",envoy_cluster_name="service_pubsub",le="2500"} 302
envoy_cluster_grpc_v1_Publisher_ListTopics_upstream_rq_time_bucket{envoy_grpc_bridge_method="pubsub",envoy_grpc_bridge_service="google",envoy_cluster_name="service_pubsub",le="5000"} 302
envoy_cluster_grpc_v1_Publisher_ListTopics_upstream_rq_time_bucket{envoy_grpc_bridge_method="pubsub",envoy_grpc_bridge_service="google",envoy_cluster_name="service_pubsub",le="10000"} 302
envoy_cluster_grpc_v1_Publisher_ListTopics_upstream_rq_time_bucket{envoy_grpc_bridge_method="pubsub",envoy_grpc_bridge_service="google",envoy_cluster_name="service_pubsub",le="30000"} 302
envoy_cluster_grpc_v1_Publisher_ListTopics_upstream_rq_time_bucket{envoy_grpc_bridge_method="pubsub",envoy_grpc_bridge_service="google",envoy_cluster_name="service_pubsub",le="60000"} 302
envoy_cluster_grpc_v1_Publisher_ListTopics_upstream_rq_time_bucket{envoy_grpc_bridge_method="pubsub",envoy_grpc_bridge_service="google",envoy_cluster_name="service_pubsub",le="300000"} 302
envoy_cluster_grpc_v1_Publisher_ListTopics_upstream_rq_time_bucket{envoy_grpc_bridge_method="pubsub",envoy_grpc_bridge_service="google",envoy_cluster_name="service_pubsub",le="600000"} 302
envoy_cluster_grpc_v1_Publisher_ListTopics_upstream_rq_time_bucket{envoy_grpc_bridge_method="pubsub",envoy_grpc_bridge_service="google",envoy_cluster_name="service_pubsub",le="1800000"} 302
envoy_cluster_grpc_v1_Publisher_ListTopics_upstream_rq_time_bucket{envoy_grpc_bridge_method="pubsub",envoy_grpc_bridge_service="google",envoy_cluster_name="service_pubsub",le="3600000"} 302
envoy_cluster_grpc_v1_Publisher_ListTopics_upstream_rq_time_bucket{envoy_grpc_bridge_method="pubsub",envoy_grpc_bridge_service="google",envoy_cluster_name="service_pubsub",le="+Inf"} 302
envoy_cluster_grpc_v1_Publisher_ListTopics_upstream_rq_time_sum{envoy_grpc_bridge_method="pubsub",envoy_grpc_bridge_service="google",envoy_cluster_name="service_pubsub"} 55370
envoy_cluster_grpc_v1_Publisher_ListTopics_upstream_rq_time_count{envoy_grpc_bridge_method="pubsub",envoy_grpc_bridge_service="google",envoy_cluster_name="service_pubsub"} 302
Run Prometheus
Now run prometheus in a container.
The following promethus.yml file will automatically connect to the envoy stats endpoint shown above and will begin to scrape data
docker run \
    --net=host \
    -p 9090:9090 \
    -v `pwd`/prometheus/prometheus.yml:/etc/prometheus/prometheus.yml \
    prom/prometheus
Verify Envoy Target is running by going to http://localhost:9090/targets
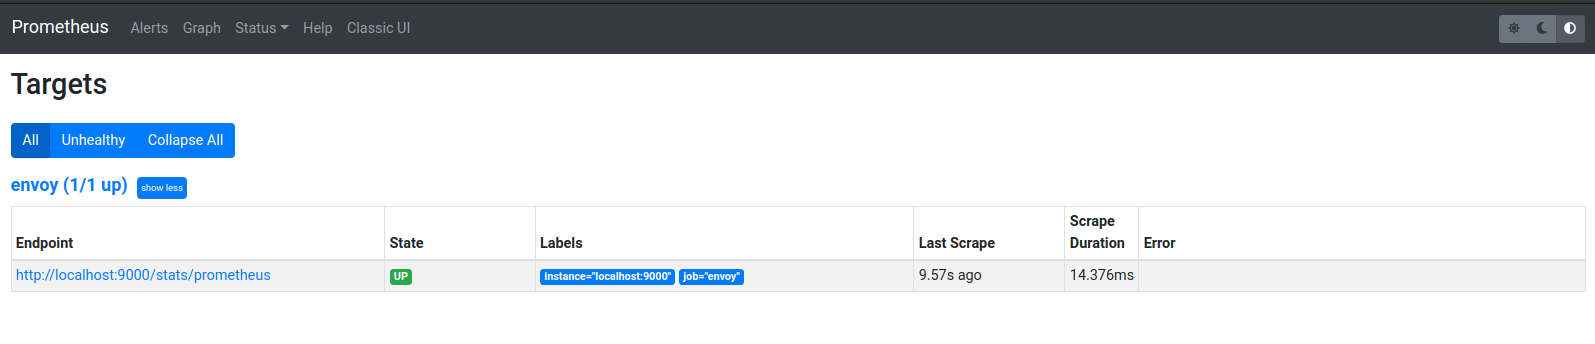
You should also see prometheus collecting gRPC Statistics
Run Grafana
Now that prometheus is collecting data, we can now ask grafana to use it as a datasource.
First run Grafana ina container
docker run --net=host -p 3000:3000 grafana/grafana
Access Console at http://localhost:3000 (the default username/password is admin/admin)
Configure the prometheus Datasource
so under configuration => datasources, Select Prometheus, set
    Name: `envoy`
    URL: `http://localhost:9090/`
Click Test (which hopefully works!).
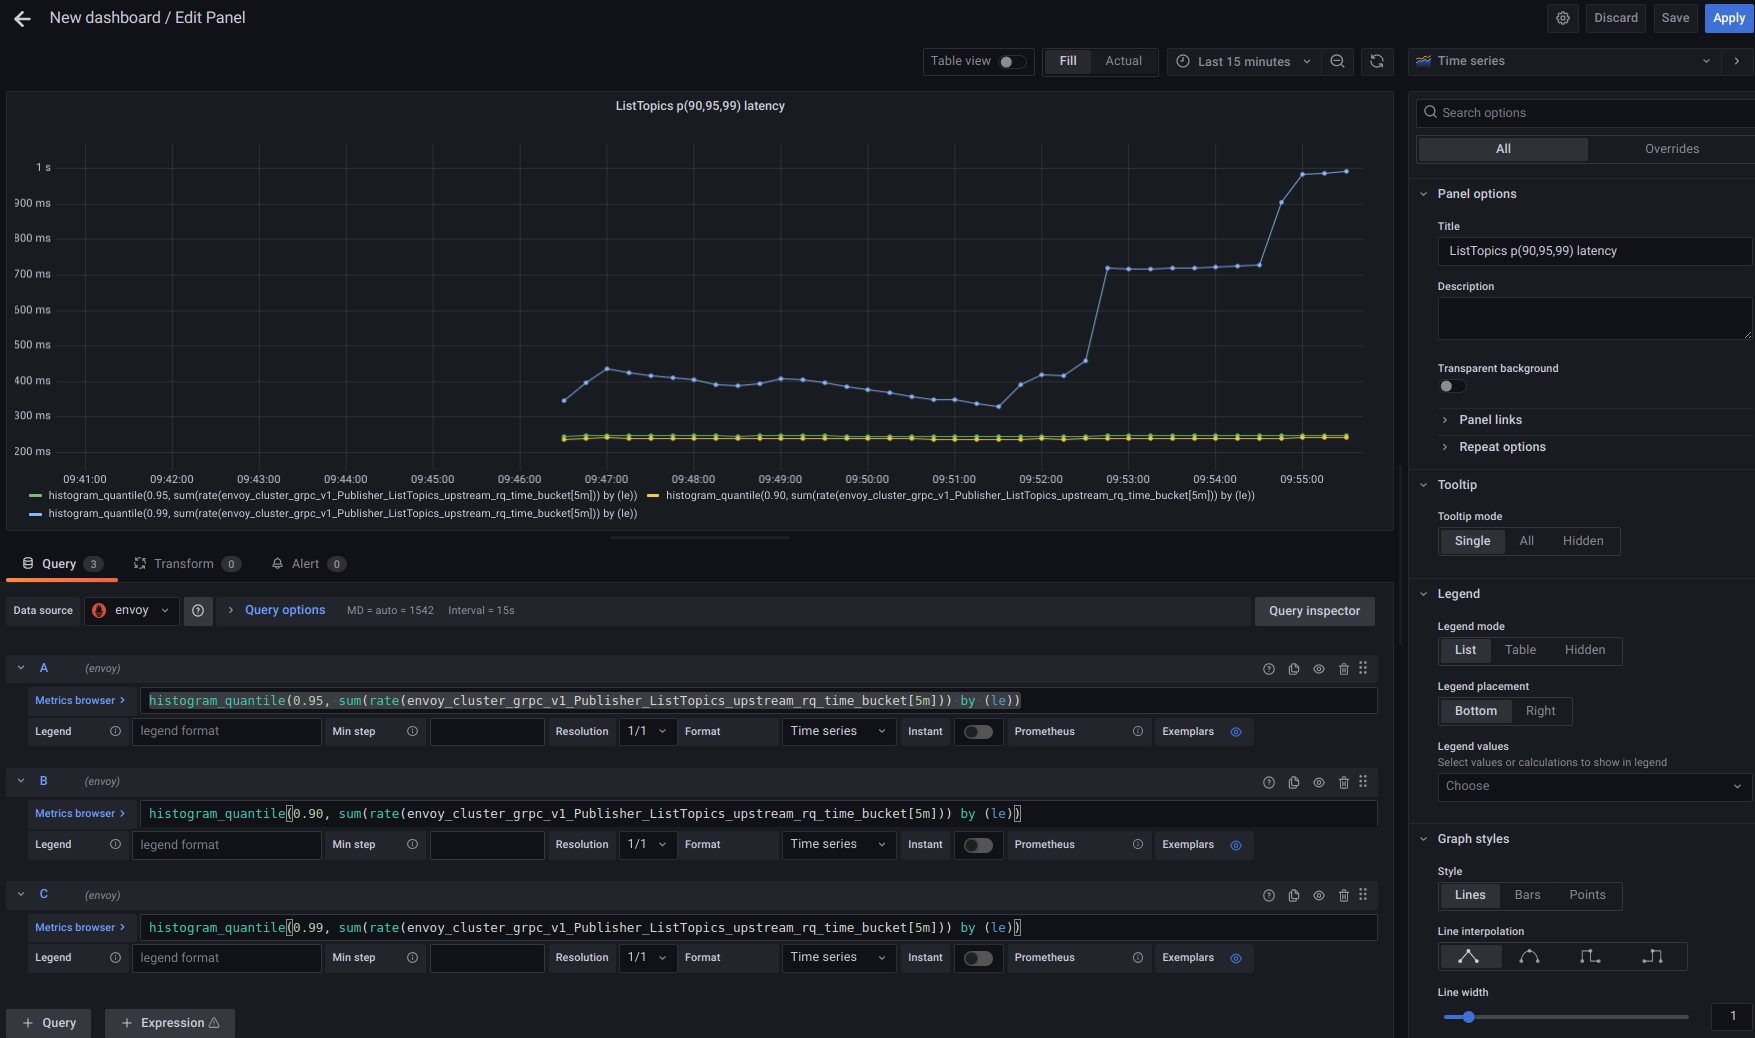
From there, you can display the usages statistics as graph:
Appendix
gRPC Environment Variables
To enable verbose logging for gRPC see the setof gRPC Environment Variables
Specifically for golang, enable the set shown below
export GRPC_VERBOSITY=DEBUG
export GRPC_TRACE=all
# export GRPC_GO_LOG_VERBOSITY_LEVEL=99
# export GRPC_GO_LOG_SEVERITY_LEVEL=info
TLS CA
Thseare the TLS Certificates used for this sample that you should add to /etc/ssl/certs/ca-certificates.crt (on debian, atleast)
-----BEGIN CERTIFICATE-----
MIIDfjCCAmagAwIBAgIBATANBgkqhkiG9w0BAQUFADBQMQswCQYDVQQGEwJVUzEP
MA0GA1UECgwGR29vZ2xlMRMwEQYDVQQLDApFbnRlcnByaXNlMRswGQYDVQQDDBJF
bnRlcnByaXNlIFJvb3QgQ0EwHhcNMjAwNDI1MjIwNDQxWhcNMzAwNDI1MjIwNDQx
WjBQMQswCQYDVQQGEwJVUzEPMA0GA1UECgwGR29vZ2xlMRMwEQYDVQQLDApFbnRl
cnByaXNlMRswGQYDVQQDDBJFbnRlcnByaXNlIFJvb3QgQ0EwggEiMA0GCSqGSIb3
DQEBAQUAA4IBDwAwggEKAoIBAQDxuasMnn/6NdpXZk9FnWE109YIUDXdPyN7Qiq1
mX54dBzoC/vZ1mlLyATGe9+DF9cgRa1apQAlid4cUsazo1Tropivf+y/gt9/6mXO
X0zEAZgwnw4VU6NXAVpyzMFiV8kFO18lzUlXdt92SGRiS6Bpk0oxuNZBYKx8SUDY
U7veKF2Gz9GcF5MXUQ5VxbUPqvFcuKGR4DRFAYUQWhB+c2XWr3Z7ibap5HxSRFJl
TZnE7GdeowwzV8/k2bmRWTznhJrGbnXRUykBF+Jhs29BRfqlKroJqL8MZ4VS9j+J
fQRIxYkG4JxfSOuL3mELJQUvZfZADMb60dPrMqJQeItBDndJAgMBAAGjYzBhMA4G
A1UdDwEB/wQEAwIBBjAPBgNVHRMBAf8EBTADAQH/MB0GA1UdDgQWBBSaVNYZIVg6
RrbUrgV+gHD0OM8oDDAfBgNVHSMEGDAWgBSaVNYZIVg6RrbUrgV+gHD0OM8oDDAN
BgkqhkiG9w0BAQUFAAOCAQEAJHWSDi4Ku1L2h1L3Xz3EvDfARTBkBpMkTylQQ/yW
Y14CNso7cpZMnEmHhpscZHXzfFIKQgQXhSV4UeF1qSsVau5n37Kpf93XV/i8zL33
EAm/1HwrMCfVdBLx8pAj6GmuigPAnO5wH9B+KMolVyp91fptilmVzznp/KdMzurl
BqDjlLCt8eWzZ0WTmJhc0nWfgdwhlKD5DeUe6tmpahZK3ls3j1/F62FuccwJioem
krx0EqCm02vc8QU/r7OAEEgenmmak+yrKz4MV3LtdzO+R0F7/OMObepAE1ppCaP4
3Nh6qNxO8UxfBjkfxnGEkp9VicG96HSplK/L3CHYHLvKzQ==
-----END CERTIFICATE-----
-----BEGIN CERTIFICATE-----
MIIEDTCCAvWgAwIBAgIBAjANBgkqhkiG9w0BAQUFADBQMQswCQYDVQQGEwJVUzEP
MA0GA1UECgwGR29vZ2xlMRMwEQYDVQQLDApFbnRlcnByaXNlMRswGQYDVQQDDBJF
bnRlcnByaXNlIFJvb3QgQ0EwHhcNMjAwNDI1MjIwNzE1WhcNMzAwNDI1MjIwNzE1
WjBXMQswCQYDVQQGEwJVUzEPMA0GA1UECgwGR29vZ2xlMRMwEQYDVQQLDApFbnRl
cnByaXNlMSIwIAYDVQQDDBlFbnRlcnByaXNlIFN1Ym9yZGluYXRlIENBMIIBIjAN
BgkqhkiG9w0BAQEFAAOCAQ8AMIIBCgKCAQEA2FXMxoPucnmPbeaYvtC7mwqMqS/D
RGuGmk78f8cLLmtf4qcfQwS5t5UkEAUiHaDGTdkk8AWRVGc4Sh/nwxlsEMw7thkl
W3zge8cU7V+pWjGokaYiLPqayV3CJ7VpYPIbXRGqeXQrSAh3h5vPmFn2IN4TZF2E
46Fob8xhqjYc9CAGqh8NevCyvyNvnb2ZTzQeC2jouRStltdHh97ynK/iatyzyot0
+9BrhI/9CBELS1MDGxcT35g48pEJzHr1/k3Wdz2VM0+pKSIBhiJM1t4Q1LALhP7L
KSr6Ex3H1OzaBEW8gpIoKlkH6I1D9lOs1rSSJU4ZEsVqft+3j32SByZNmQIDAQAB
o4HqMIHnMA4GA1UdDwEB/wQEAwIBBjASBgNVHRMBAf8ECDAGAQH/AgEAMB0GA1Ud
DgQWBBS/4RzwIkiP/DvPXdntrohwId/dhjAfBgNVHSMEGDAWgBSaVNYZIVg6RrbU
rgV+gHD0OM8oDDBFBggrBgEFBQcBAQQ5MDcwNQYIKwYBBQUHMAKGKWh0dHA6Ly9w
a2kuZXNvZGVtb2FwcDIuY29tL2NhL3Jvb3QtY2EuY2VyMDoGA1UdHwQzMDEwL6At
oCuGKWh0dHA6Ly9wa2kuZXNvZGVtb2FwcDIuY29tL2NhL3Jvb3QtY2EuY3JsMA0G
CSqGSIb3DQEBBQUAA4IBAQCIK7eSGxf7Vy/5pKVdDGgD/sG/pjBgqP6IVocvLUN0
nUzT8NMkOYraJz+LySUy55WGPeFeARcRCqeFwqz+o1BetdqOUZgouf1DuXvfyX0w
cp1Y/IEPcFnzl+U5b1F10iOLGt5llUxMd6eo1MS53SrbF3NIvQOu6aoHBlh614qk
zcx2hAhLIw5C9MvK7r5UP179ilv4x7ZYfWsM7DLvhgG8dEgQTDCPB5h6cSKIM1qI
hHzpPkrGcGtKK/Fbidjw4OP25HADV6i/GXKkjirOhVQkoj2S3RjkiNy8JvJobCFM
GJSi6m9GO8OrUA+o9r9JKYkLmLEWD5PeF7hCnbGQY+Cw
-----END CERTIFICATE-----
You are free to generate your own using CA Scratchpad
If you do use your own CA, please remember that when you configure the certificate envoy will use (certs/googleapis.crt) to include all the SNI hosts you intend to test:
eg
            X509v3 Subject Alternative Name:
                DNS:edgecert.googleapis.com, DNS:android.googleapis.com, DNS:bigtable.googleapis.com, DNS:clouderrorreporting.googleapis.com, DNS:cloudtrace.googleapis.com, DNS:container.googleapis.com, DNS:dataflow.googleapis.com, DNS:datastore.googleapis.com, DNS:dlp.googleapis.com, DNS:fcm.googleapis.com, DNS:firestore.googleapis.com, DNS:logging.googleapis.com, DNS:monitoring.googleapis.com, DNS:pubsub.googleapis.com, DNS:runtimeconfig.googleapis.com, DNS:servicecontrol.googleapis.com, DNS:spanner.googleapis.com, DNS:stackdriver.googleapis.com, DNS:*.googleapis.com
Set Trust CA for GCP CLients
If you want to set the trust and host overrides in code:
	rootCAs := x509.NewCertPool()
	pem, err := ioutil.ReadFile("../certs/tls-ca.crt")
	if err != nil {
		fmt.Printf("failed to load root CA certificates  error=%v", err)
		return
	}
	if !rootCAs.AppendCertsFromPEM(pem) {
		fmt.Printf("no root CA certs parsed from file ")
		return
	}

	transportCreds := credentials.NewTLS(&tls.Config{
		RootCAs: rootCAs,
	})

	pubsubClient, err := pubsub.NewClient(ctx, projectID,
		option.WithEndpoint("pubsub.googleapis.com:443"),
		option.WithGRPCDialOption(grpc.WithTransportCredentials(transportCreds)))
Running Envoy on deprivleged ports
As mentioned, envoy’s container listens on privleged port :443.
If you would rather run it on a different port, you still need some listener or redirect on :443 and perform a redirect.
There are several ways to do that using socat or iptables as described here.
Just note that to do part itself requires admin privileges.
This site supports webmentions. Send me a mention via this form.